Murrey Math Lines 30.05.2018 (USDJPY, USDCAD)
USDJPY, “US Dollar vs. Japanese Yen”
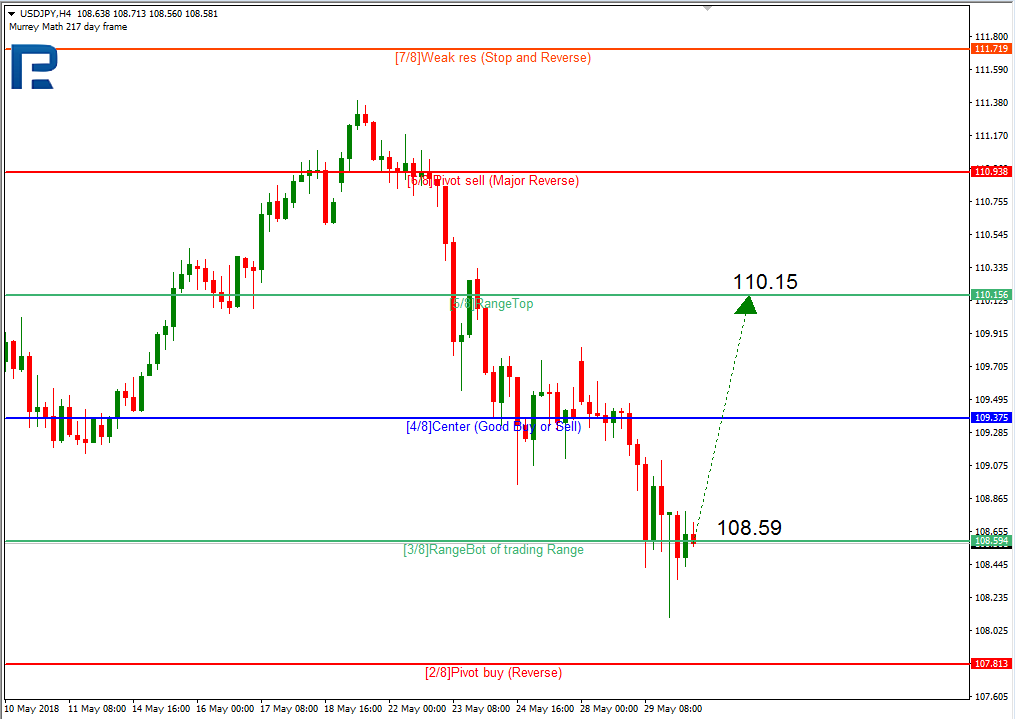
As we can see in the H4 chart, USDJPY is consolidating between the 3/8 and 5/8 levels. If the price rebounds from the 3/8 level, the instrument may resume growing to reach the 5/8 one.

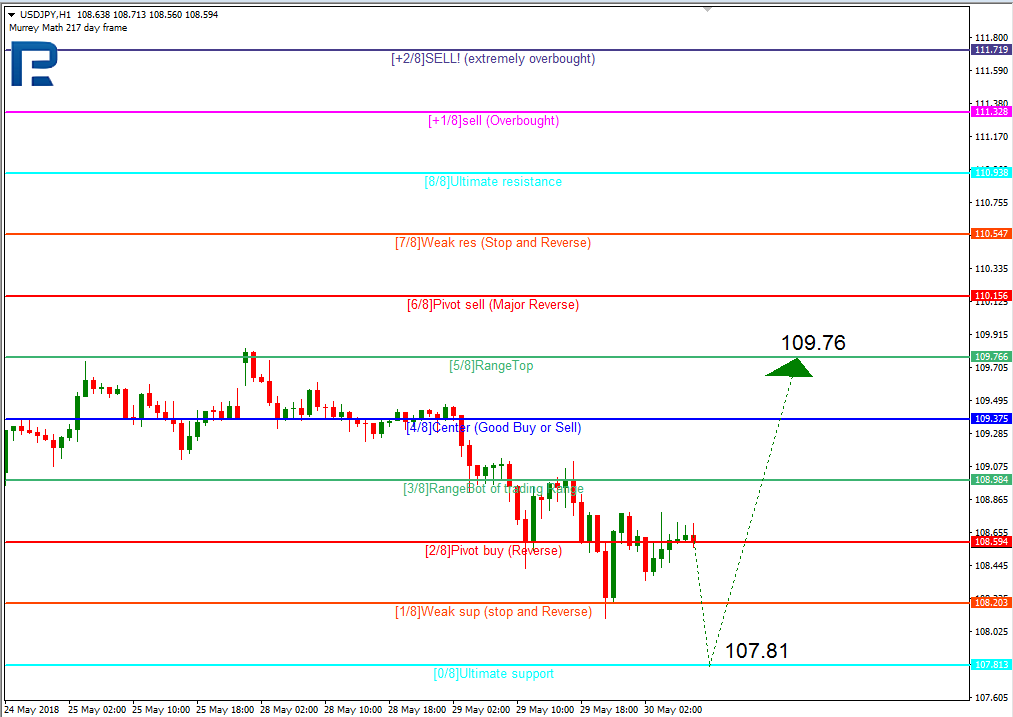
In the H1 chart, the pair may test the 0/8 level, rebound from it, and then continue trading upwards to reach the 5/8 one.
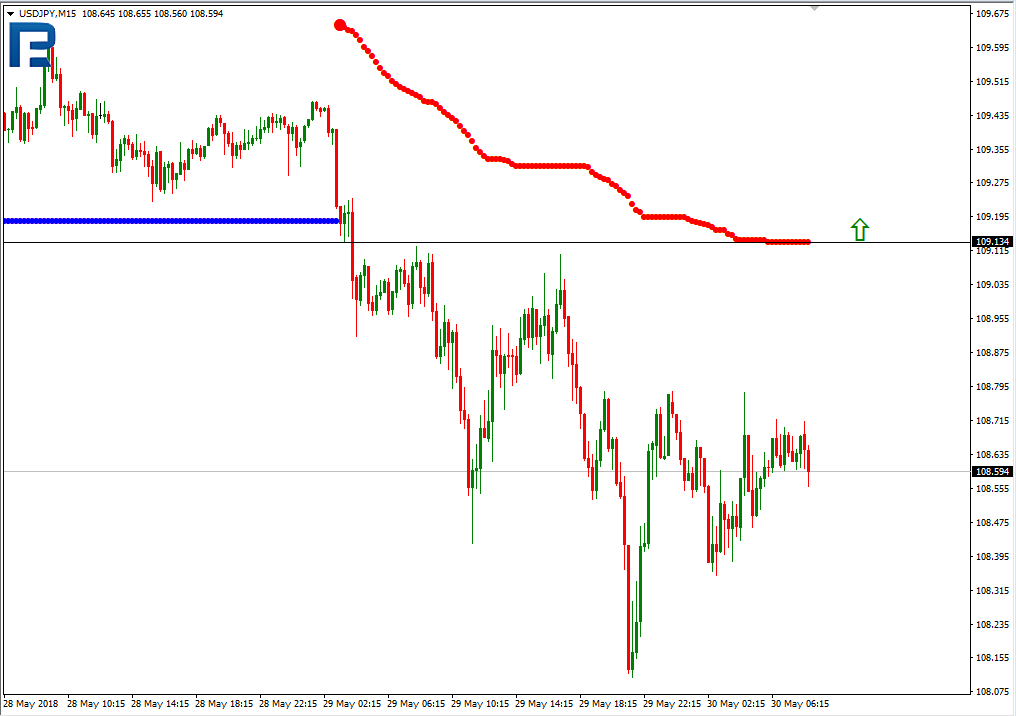
In the M15 chart, the pair may break the upside line of the VoltyChannel indicator and, as a result, continue trading to the upside.
USDCAD, “US Dollar vs Canadian Dollar”
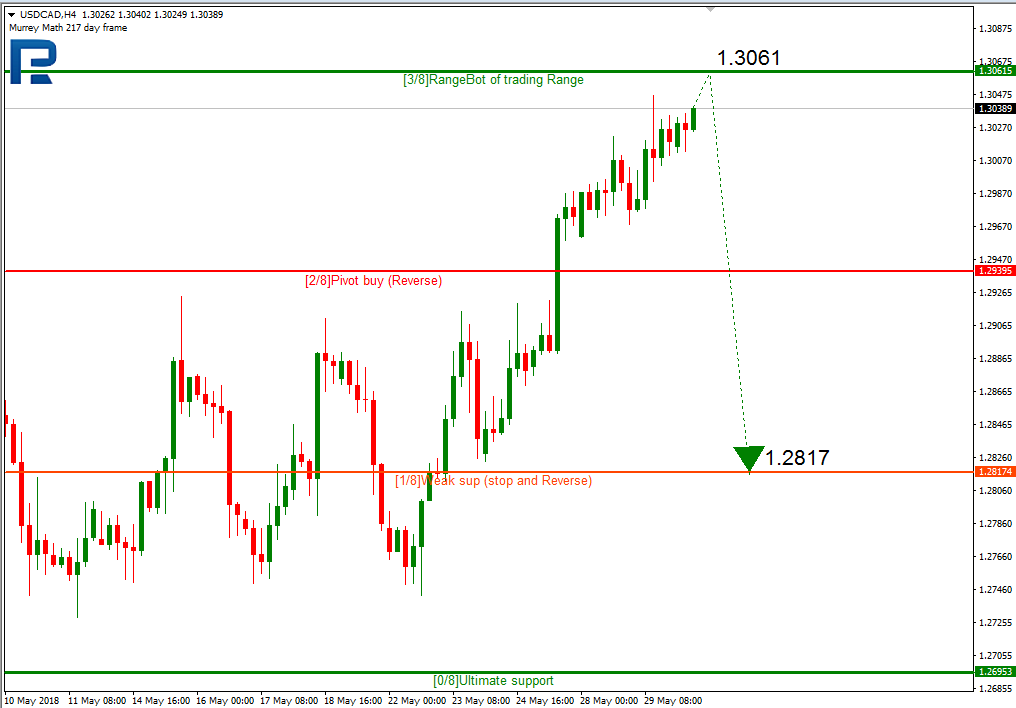
In the H4 chart, USDCAD is expected to test the resistance at the 3/8 level, rebound from it, and then resume falling towards the support at the 1/8 one.
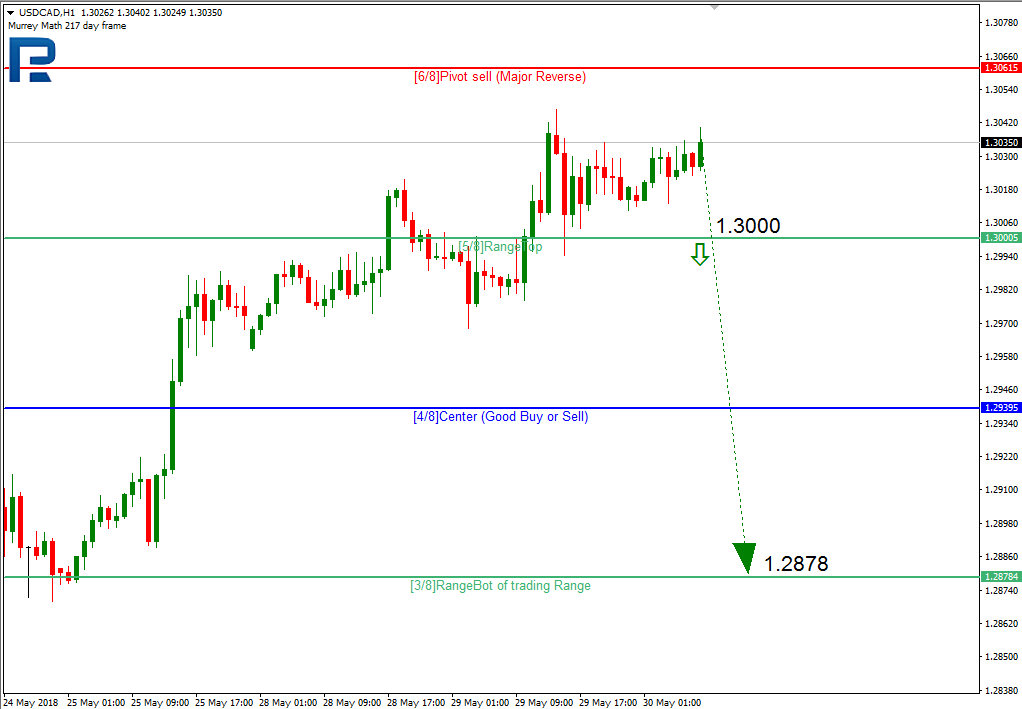
As we can see in the H1 chart, the pair may break the 5/8 level and then continue trading towards the support at the 3/8 one.
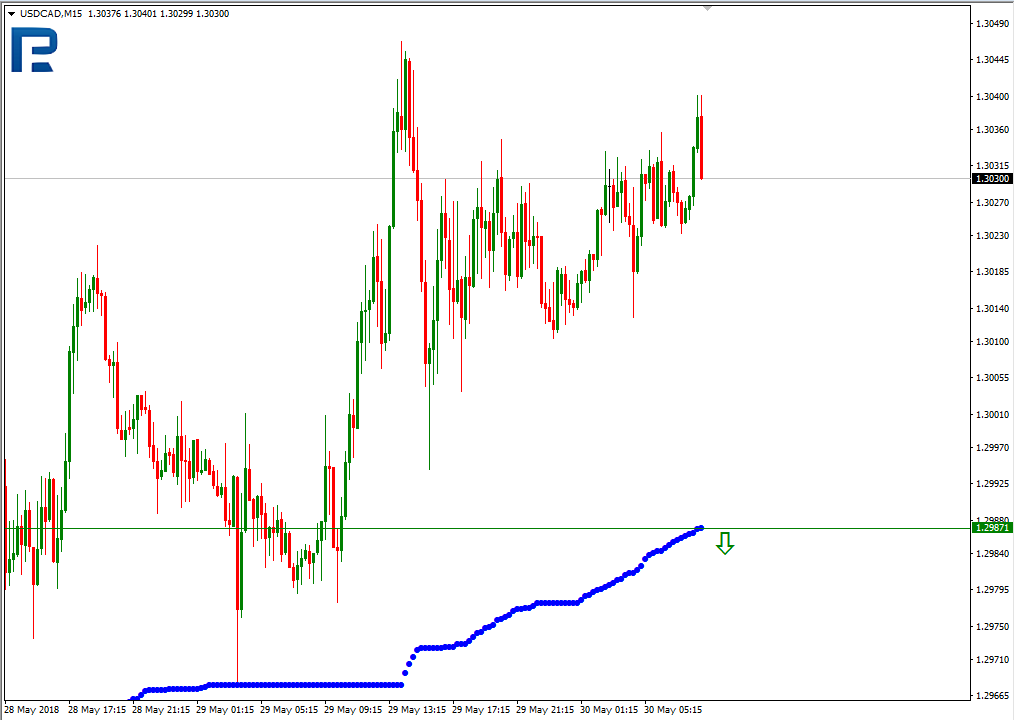
In the M15 chart, the pair may break the downside line of the VoltyChannel indicator and, as a result, continue moving downwards.
RoboForex Analytical Department
Forecasts presented in this section only reflect the author’s private opinion and should not be considered as guidance for trading. RoboForex bears no responsibility for trading results based on trading recommendations described in these analytical reviews.