Murrey Math Lines 30.10.2017 (USD/CAD, AUD/USD)
USD CAD, “US Dollar vs Canadian Dollar”
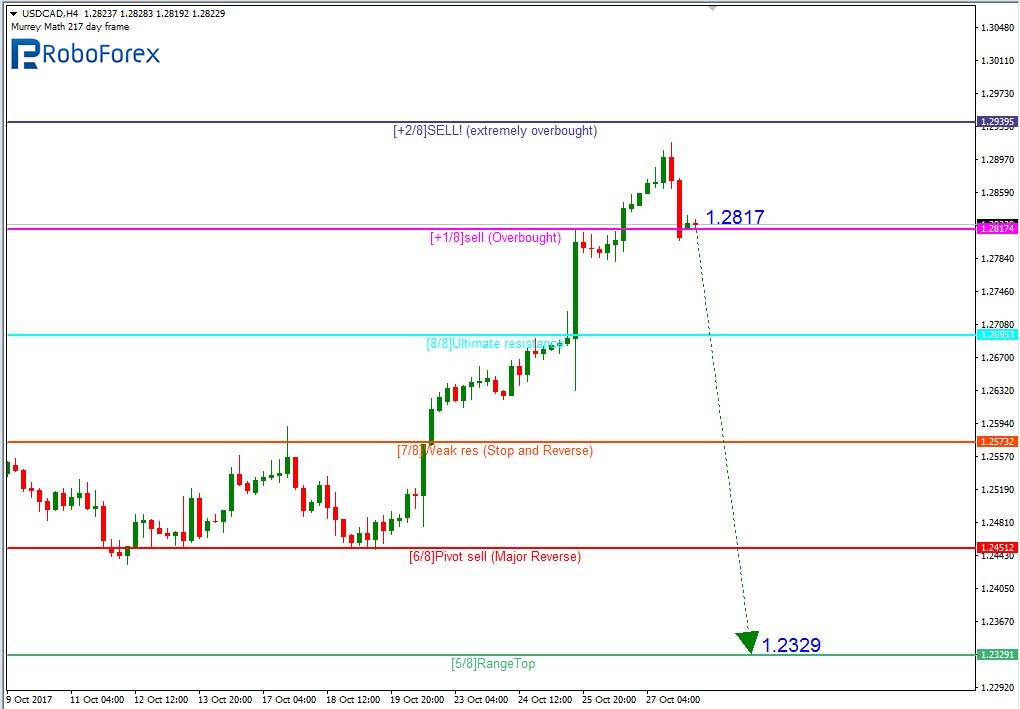
As we can see at the H4 chart, the USD/CAD pair is trading inside the “overbought zone” above the 8/8 level. The price is expected to break the +1/8 level at 1.2817 and resume falling towards the 5/8 one at 1.2329.
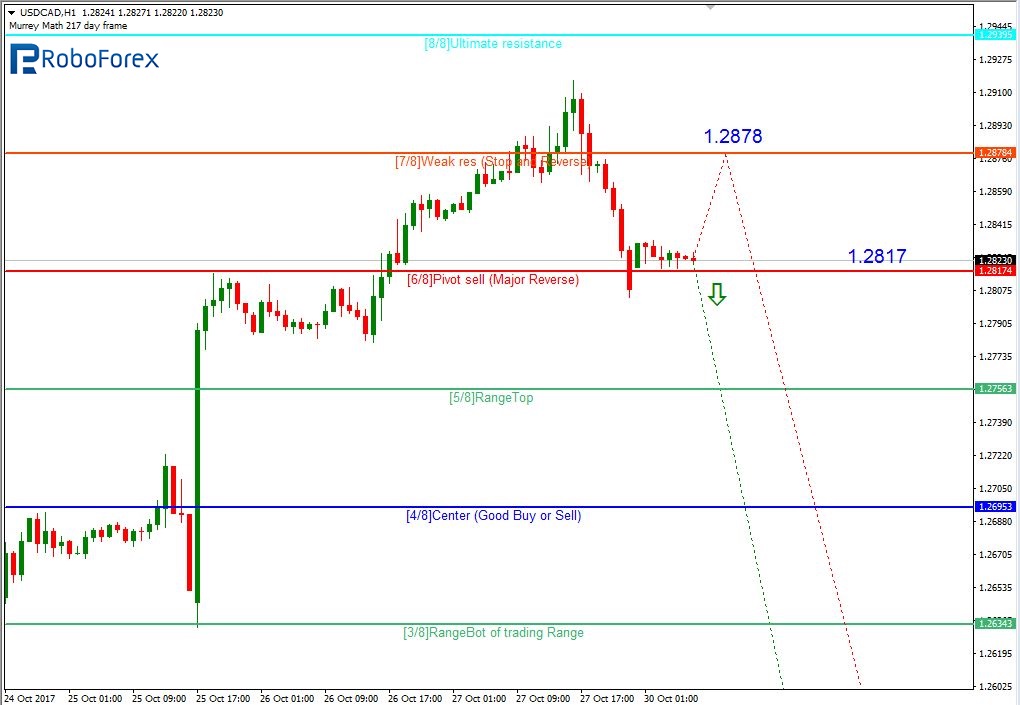
At the H1 chart, there are two possible scenario. According to the first one, the pair may break the 6/8 level at 1.2817 and then continue moving towards its main target. The second scenario implies that the instrument may test the 7/8 level at 1.2878, rebound from it, and then resume falling to reach at 1.2329.
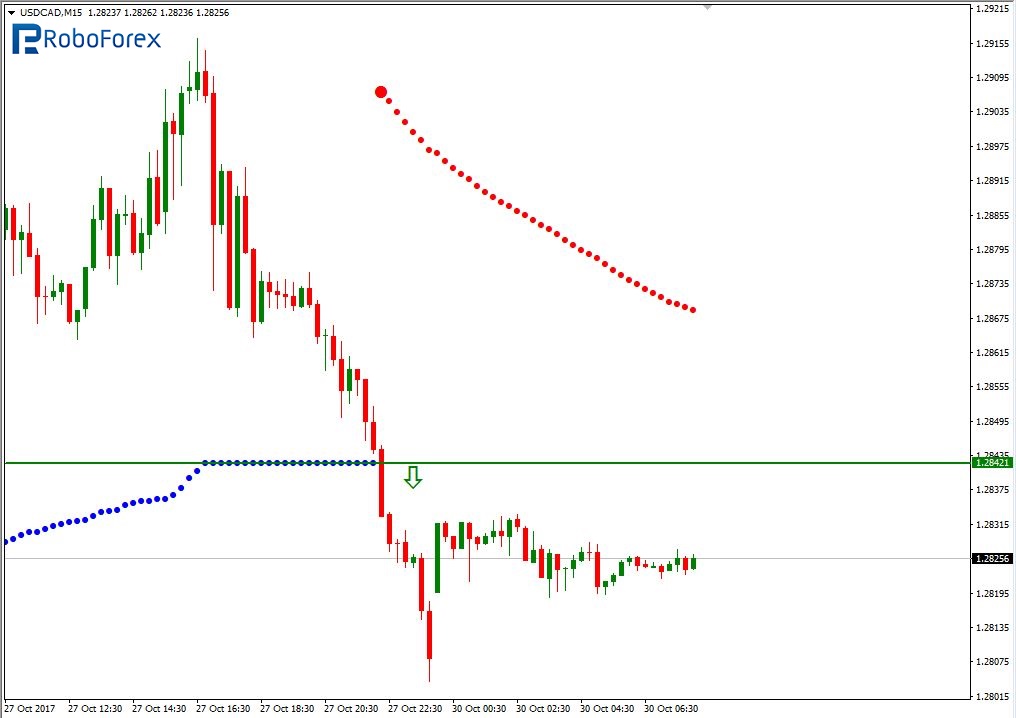
As we can see at the M15 chart, the pair has broken the downside line of the VoltyChannel indicator and, as a result, may continue moving downwards.
AUD USD, “Australian Dollar vs US Dollar”
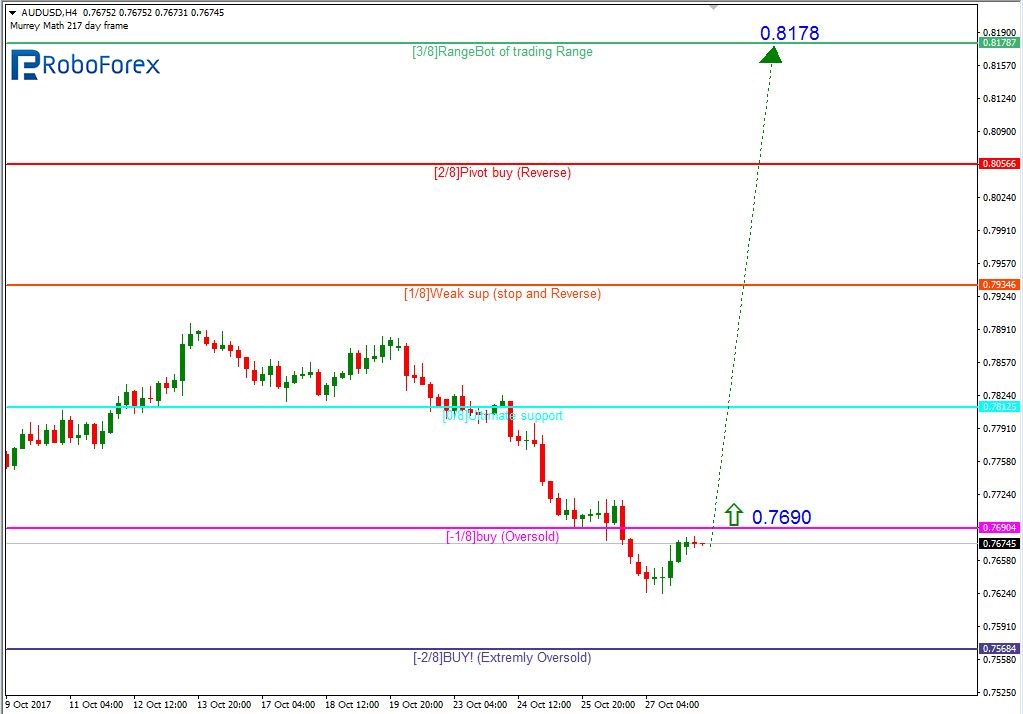
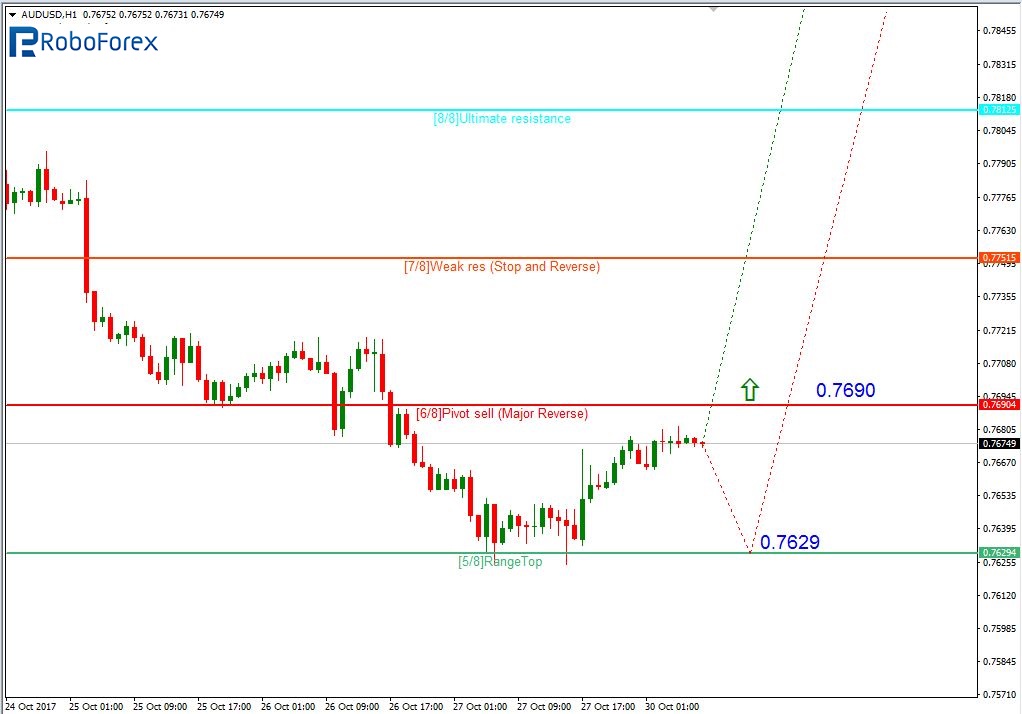
At the H4 chart, the AUD/USD pair is trading inside the “oversold zone” below the 0/8 level. The price is expected to break the -1/8 level at 0.7690 and then continue growing to reach the 3/8 one at 0.8178.
As we can see at the H1 chart, the pair has rebounded from the 5/8 level at 0.7629 and, as a result, may continue moving upwards. Possibly, the price may test the 5/8 level at 0.7629 once again, rebound from it, and then resume growing.
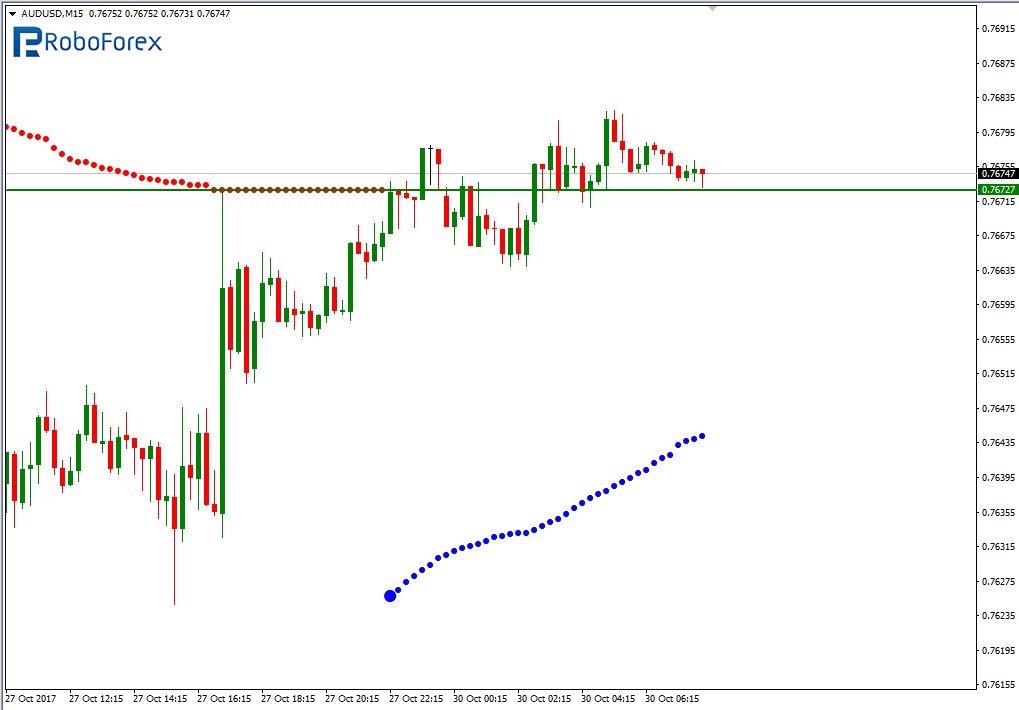
As we can see at the M15 chart, the pair has broken the upside line of the VoltyChannel indicator and is expected to continue growing towards 0.8178.
RoboForex Analytical Department
Forecasts presented in this section only reflect the author’s private opinion and should not be considered as guidance for trading. RoboForex bears no responsibility for trading results based on trading recommendations described in these analytical reviews.