Murrey Math Lines 08.11.2017 (NZD/USD, USD/CAD)
NZD USD, “New Zealand Dollar vs US Dollar”
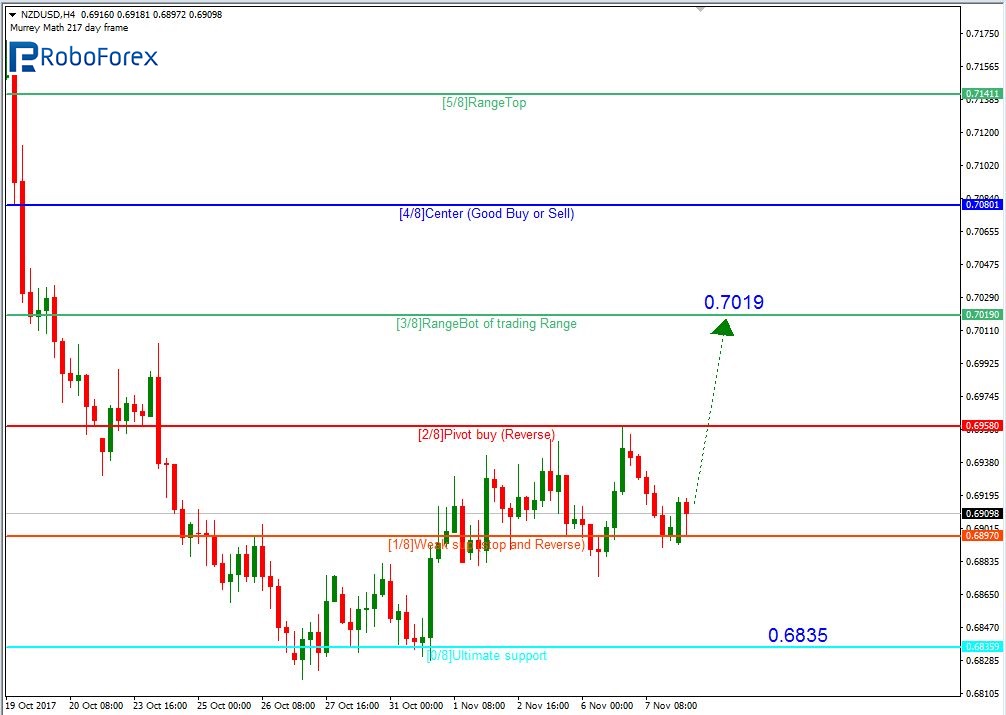
As we can see at the H4 chart, the NZD/USD pair hasn’t been able to break the consolidation channel between the 1/8 and 2/8 levels. However, the price yet may grow towards the 3/8 level at 0.7019.
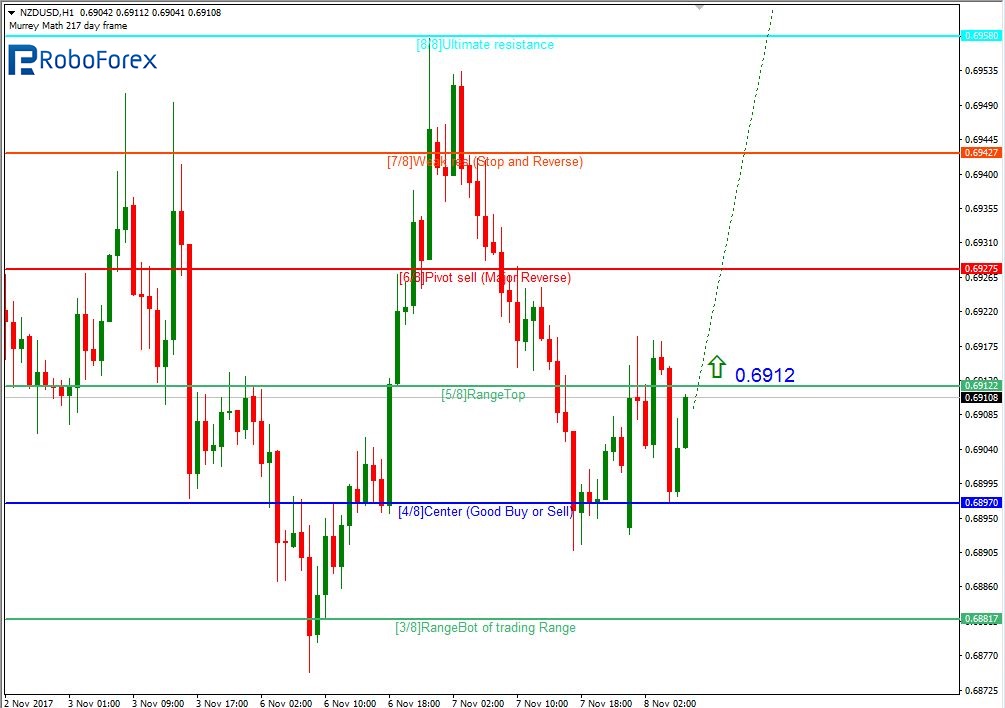
At the H1 chart, the pair is consolidating between the 3/8 and 5/8 levels. If the price breaks the latter level, it may continue moving upwards to reach 0.7019.
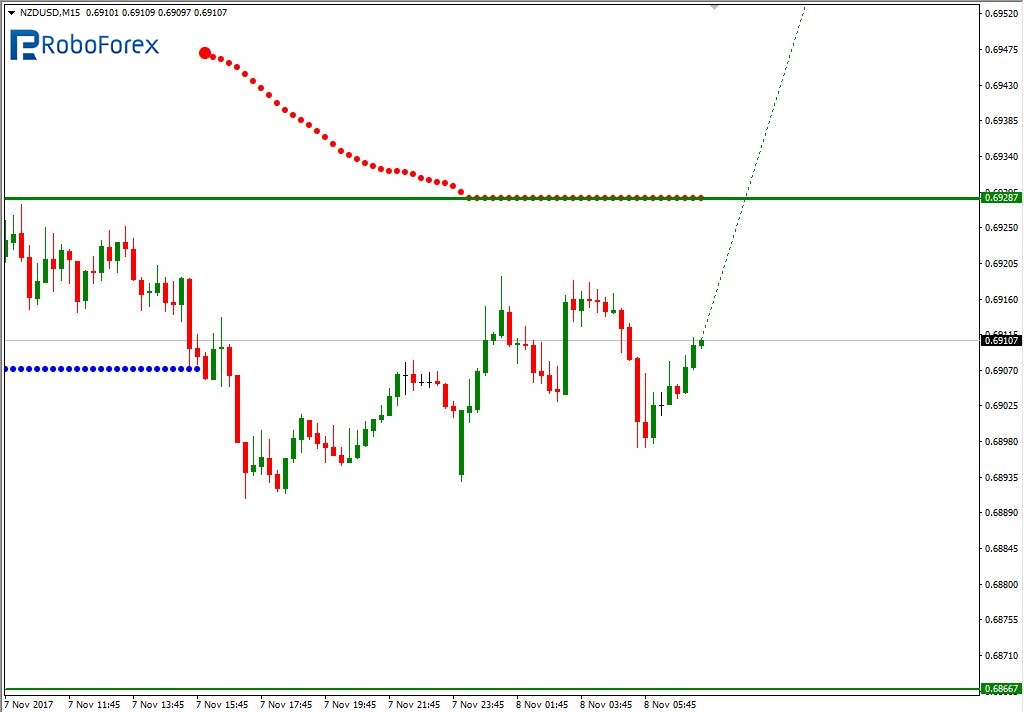
At the M15 chart, the pair may break the upside line of the VoltyChannel indicator and, as a result, continue trading to the upside towards 0.7019.
USD CAD, “US Dollar vs Canadian Dollar”
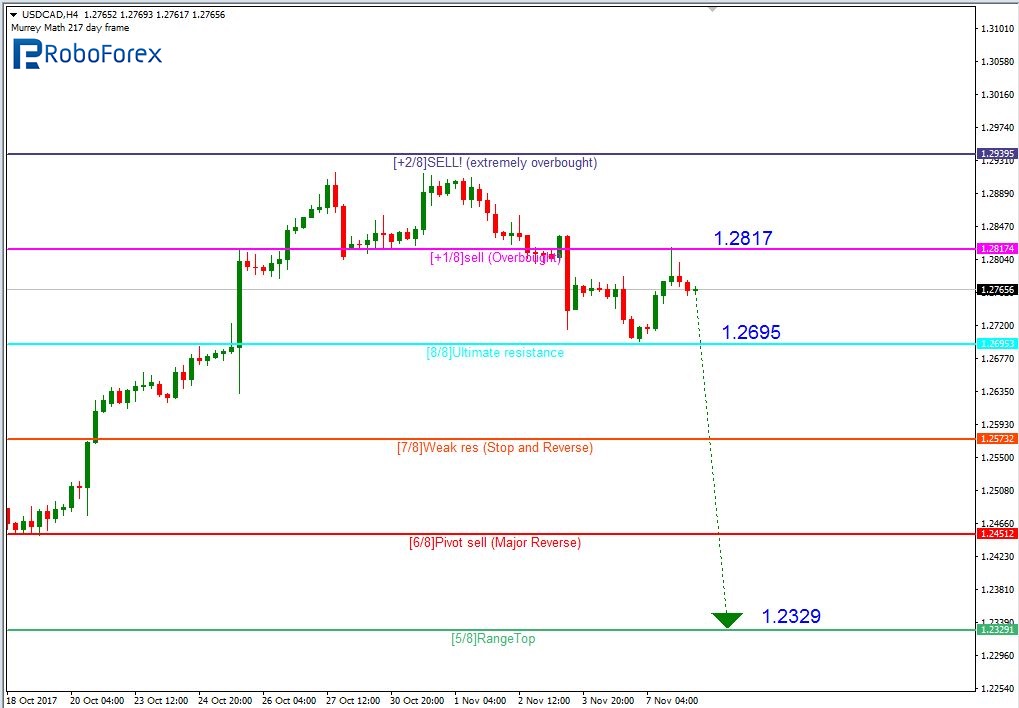
As we can see at the H4 chart, the USD/CAD pair is trading inside the “overbought zone” above the 8/8 level at 1.2695. In the future, the instrument may reverse and resume falling the 5/8 level at 1.2329.
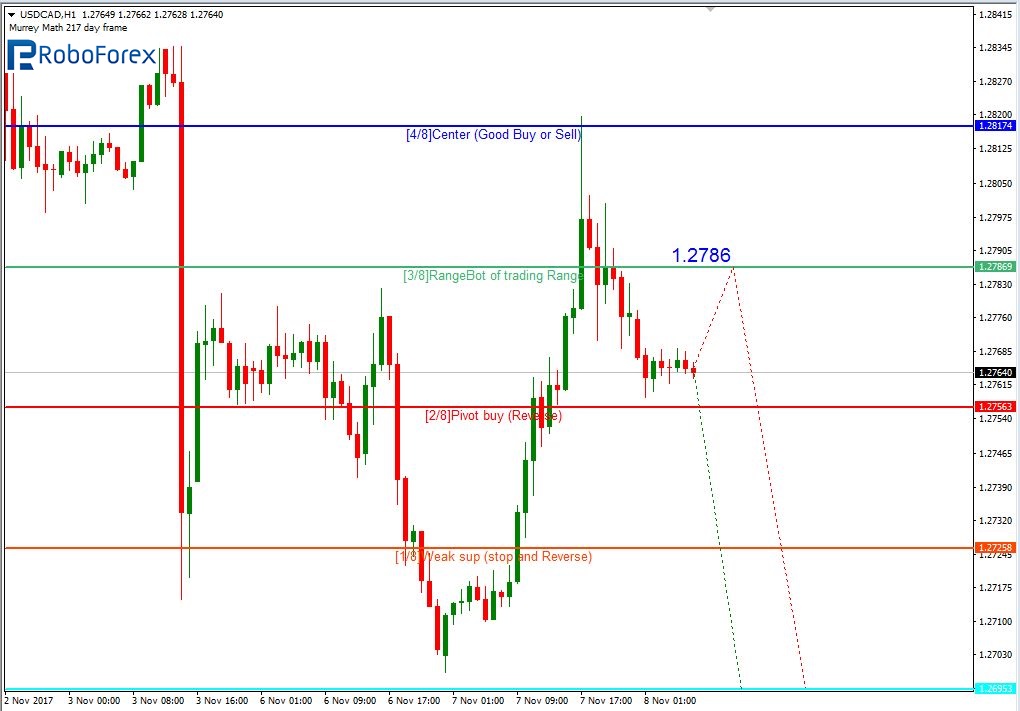
At the H1 chart, the pair is moving below the 3/8 level at 1.2786. However, the price may yet test the 3/8 level once again.
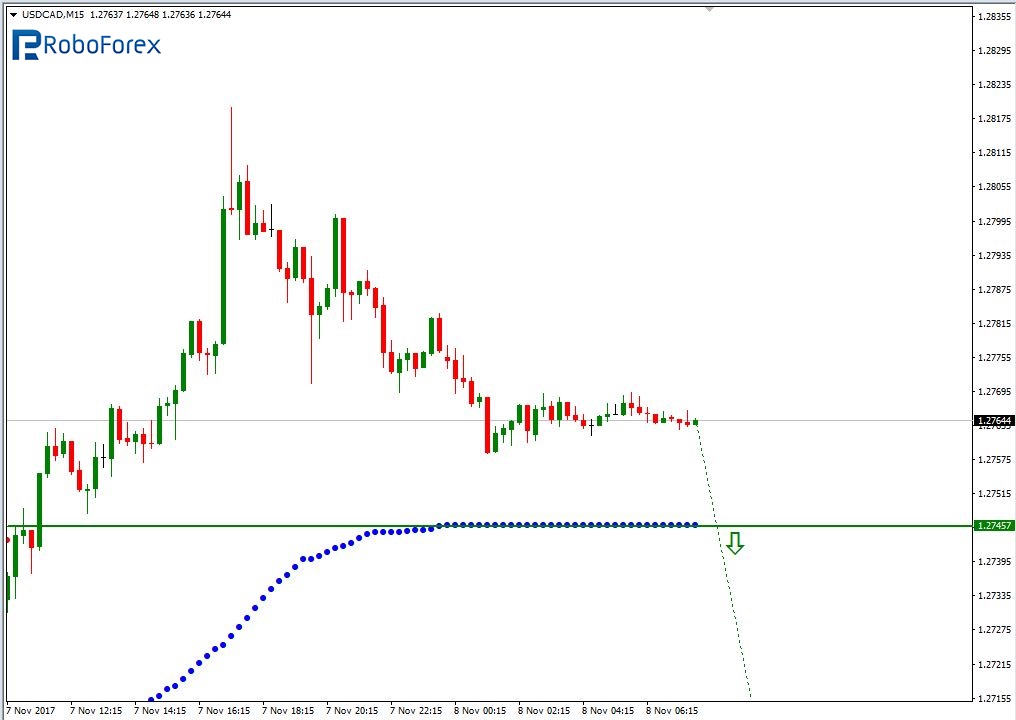
At the M15 chart, the pair may break the downside line of the VoltyChannel indicator and, as a result, continue moving downwards.
RoboForex Analytical Department
Forecasts presented in this section only reflect the author’s private opinion and should not be considered as guidance for trading. RoboForex bears no responsibility for trading results based on trading recommendations described in these analytical reviews.