Murrey Math Lines 02.10.2017 (GBP/USD, NZD/USD)
GBP USD, “Great Britain Pound vs US Dollar”
At the H4 chart, the GBP/USD pair is expected to test the 5/8 level at 1.3305, rebound from it, and then resume growing towards the resistance at the 8/8 one at 1.3671.
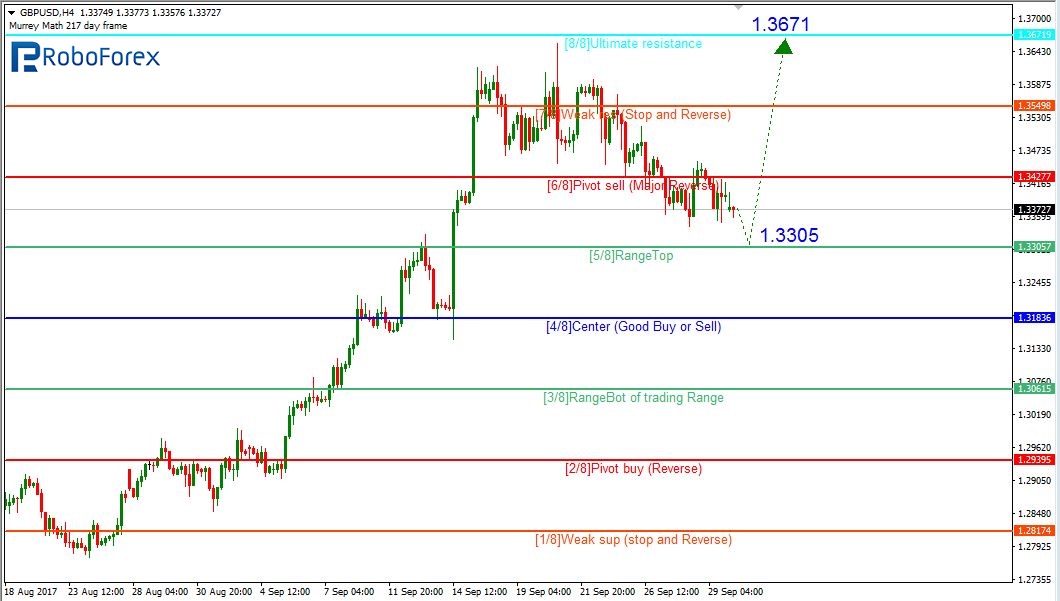
At the M15 chart, one should wait until the price reaches 1.3305 and then expect it to break the upside line of the VoltyChannel indicator. In this case, it may continue moving upwards to reach 1.3671.

NZD USD, “New Zealand Dollar vs US Dollar”
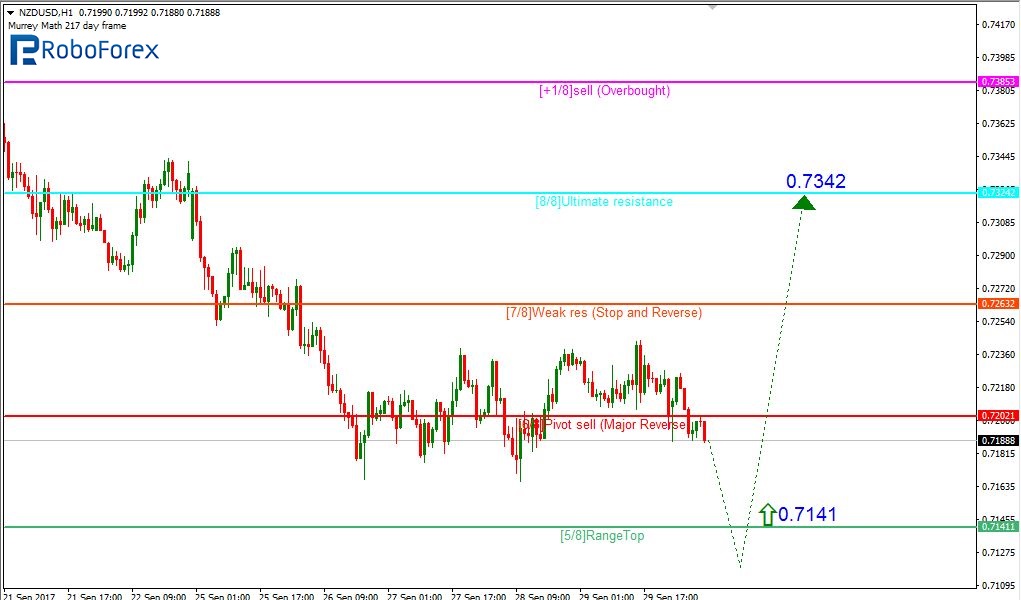
At the H4 chart, the NZD/USD pair is expected to test the 5/8 level at 0.7141, rebound from it, and then continue growing towards the resistance at the 8/8 one at 0.7324.
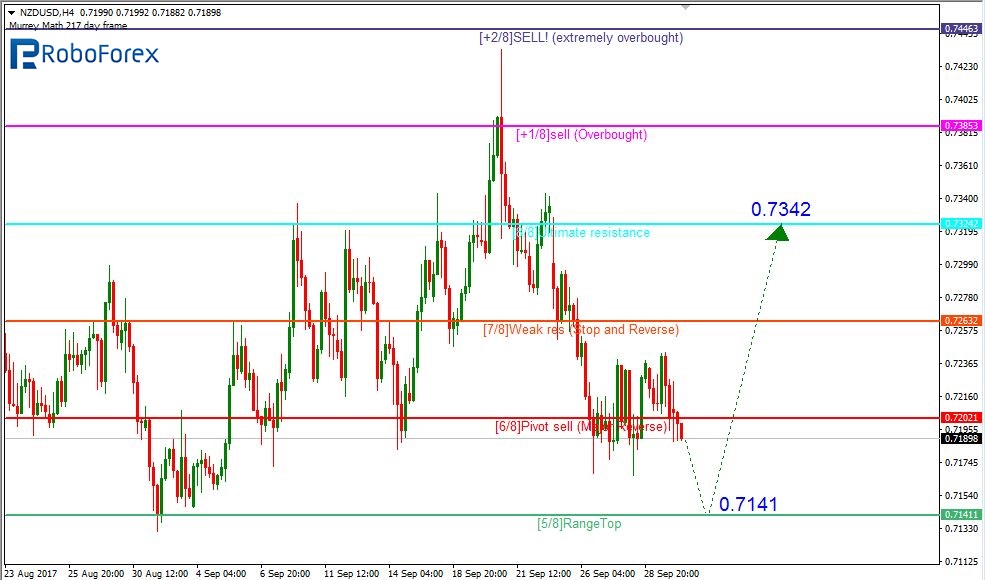
The levels at the H4 and H1 charts are completely the same, so the H4 scenario is confirmed. There may be a false breakout of the 5/8 level at 0.7141 before the price starts moving towards the resistance at the 8/8 one at 0.7324. That’s why, after the pair reaches 5/8 level, one should check the M15 chart and see if the price broke the upside line of the VoltyChannel indicator or not.
RoboForex Analytical Department
Forecasts presented in this section only reflect the author’s private opinion and should not be considered as guidance for trading. RoboForex bears no responsibility for trading results based on trading recommendations described in these analytical reviews.