Murrey Math Lines 03.10.2017 (EUR/USD, AUD/USD)
EUR USD, “Euro vs. US Dollar”
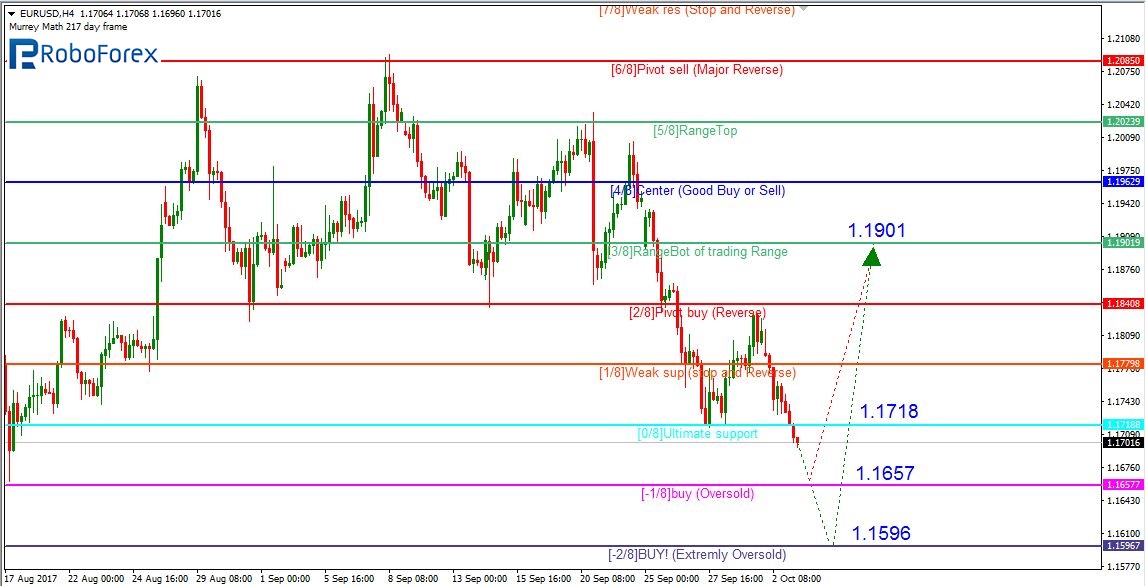
As we can see at the H4 chart, the EUR/USD pair has broken the support at the 0/8 level at 1.1718 and entered the “oversold zone”, where there are two more supports, the -1/8 and -2/8 levels at 1.1657 and 1.1596 respectively. At the moment, the latter level is considered a very strong support: the price is expected test this level, rebound from it, and then resume growing towards the resistance at the 3/8 level at 1.1901. Possibly, the instrument may rebound from the -1/8 level without testing the -2/8 one.
The levels at the H4 and H1 charts are completely the same, so the H4 scenario is confirmed. After the pair reaches any of the support levels, one should wait until the price breaks the upside line of the VoltyChannel indicator and only then consider opening positions. The broken line of the indicator will confirm a rebound and a possible growth towards 1.1901.

AUD USD, “Australian Dollar vs US Dollar”
As we can see at the H4 chart, the AUD/USD pair has broken the support at the 0/8 level at 0.7812 and right now is moving below it. If the price breaks this level to the upside and fixes above it, it may resume growing towards the 3/8 one at 0.7995.

At the H1 chart, the price is also trading below the 0/8 level at 0.7812 and may continue moving upwards. However, to confirm this scenario, the pair has to break it to the upside.

At the M15 chart, the pair may break the upside line of the VoltyChannel indicator. In this case, it may continue moving upwards to reach 0.7995.

RoboForex Analytical Department
Forecasts presented in this section only reflect the author’s private opinion and should not be considered as guidance for trading. RoboForex bears no responsibility for trading results based on trading recommendations described in these analytical reviews.