Murrey Math Lines 16.01.2018 (AUD/USD, NZD/USD)
AUD USD, “Australian Dollar vs US Dollar”
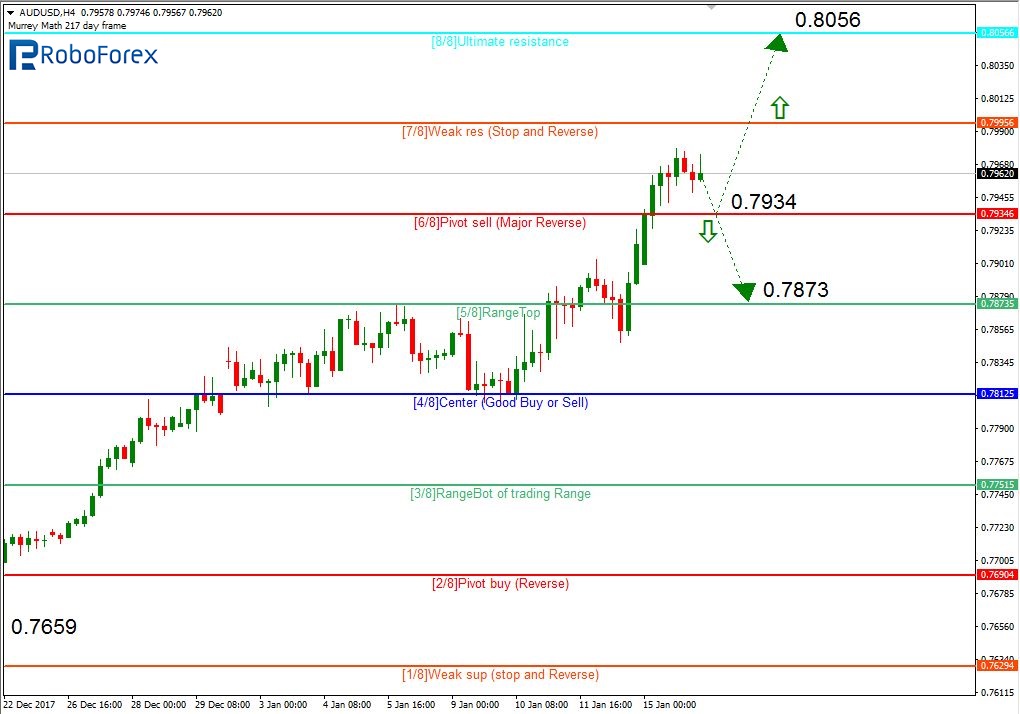
As we can see at the H4 chart, the AUD/USD pair is trading between the 6/8 and 7/8 levels. In this situation, there are two possible scenarios. The first scenario implies that the price may break the 6/8 level and continue falling towards the 5/8 one. According to the second scenario, the instrument may rebound from the 6/8 level and then grow towards the resistance at the 8/8 one.
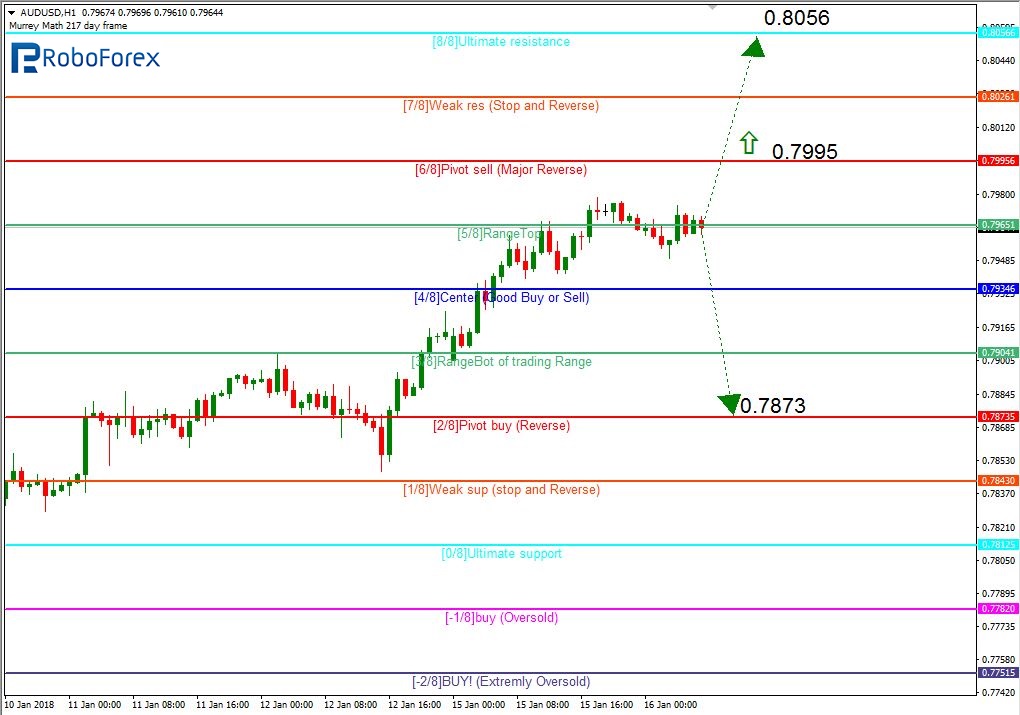
At the H1 chart, the pair is trading near the 5/8 level and may continue growing towards the resistance at the 8/8 one, but it will be possible only if the price breaks the 6/8 level. However, according to the main scenario right now the instrument is expected to rebound from the 5/8 level and fall towards the 2/8 one.
NZD USD, “New Zealand Dollar vs US Dollar”
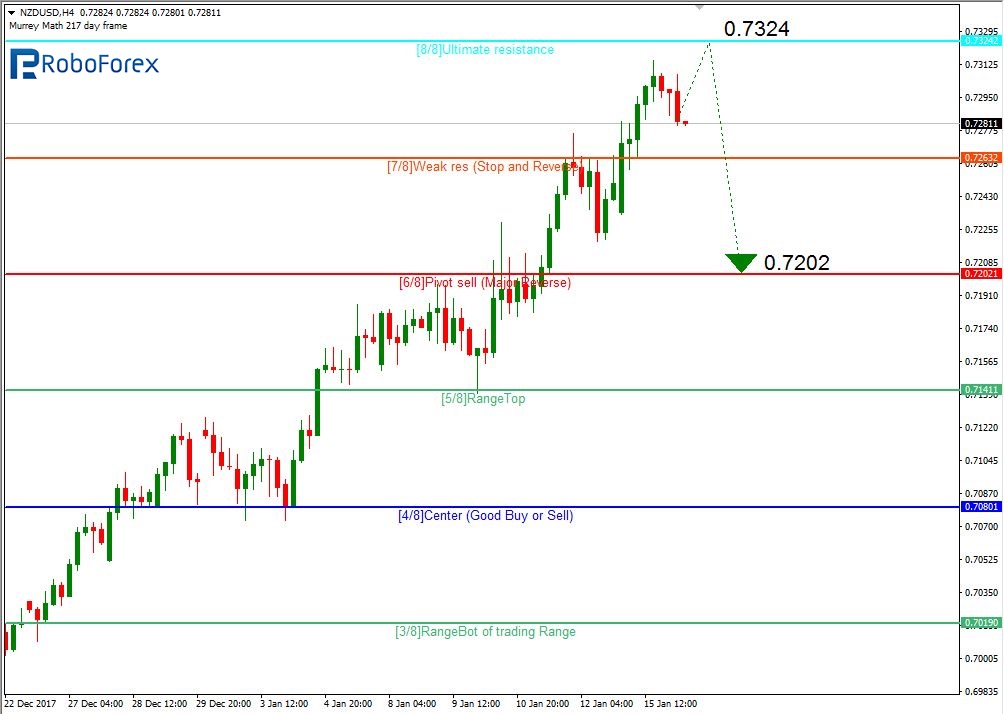
At the H4 chart, the NZD/USD pair is expected to test the resistance at the 8/8 level, rebound from it, and then resume falling towards the 6/8 one.
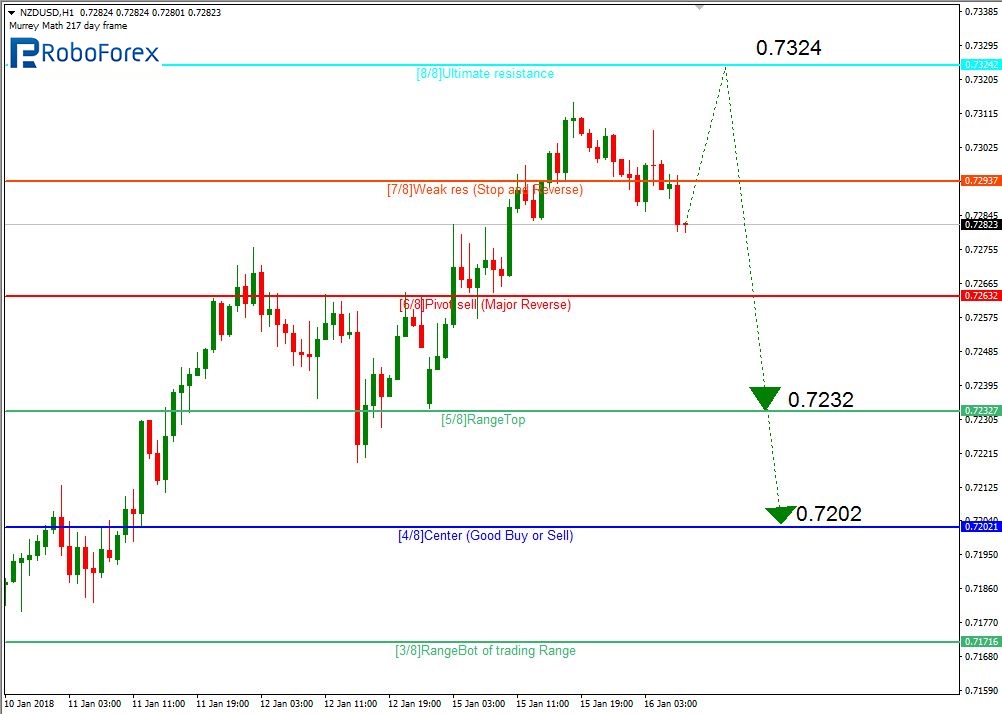
At the H1 chart, the pair may also test the resistance at the 8/8 level, rebound from it, and then resume falling towards the first target at the 5/8 level and the main target at the 4/8 one.
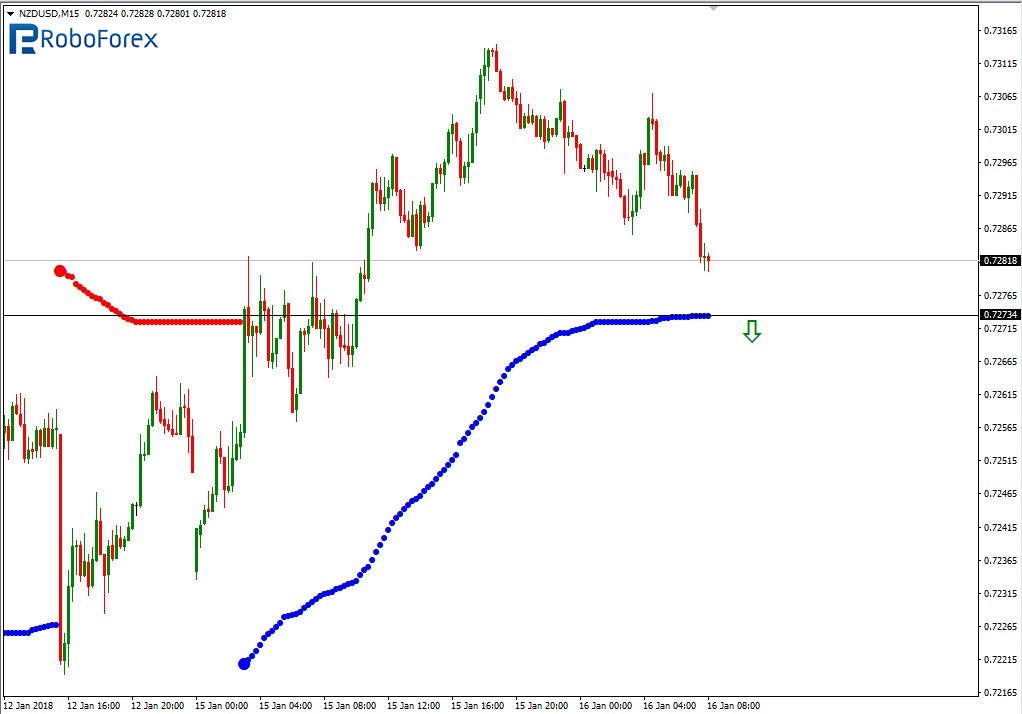
At the M15 chart, the pair may break the downside line of the VoltyChannel indicator and, as a result, continue moving downwards to reach 0.7202.
RoboForex Analytical Department
Forecasts presented in this section only reflect the author’s private opinion and should not be considered as guidance for trading. RoboForex bears no responsibility for trading results based on trading recommendations described in these analytical reviews.