Wave Analysis 17.01.2017 (EUR/USD, GBP/USD, USD/JPY, AUD/USD)
EUR USD, “Euro vs US Dollar”
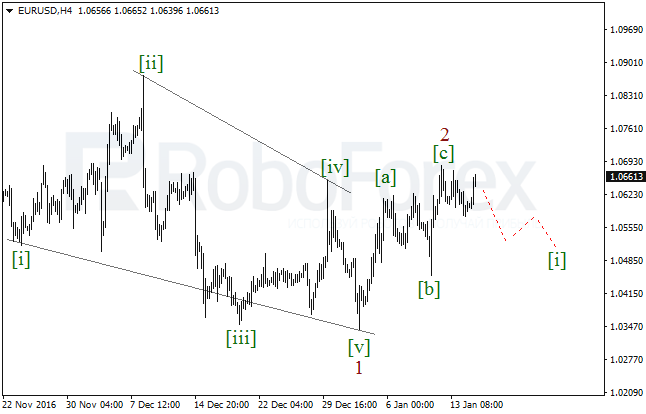
Probably, after finishing the descending wedge in the wave 1, the EUR/USD pair completed the zigzag in the wave 2. As a result, in the future the market has to form the bearish impulse in the wave [i] in order to confirm a new decline.
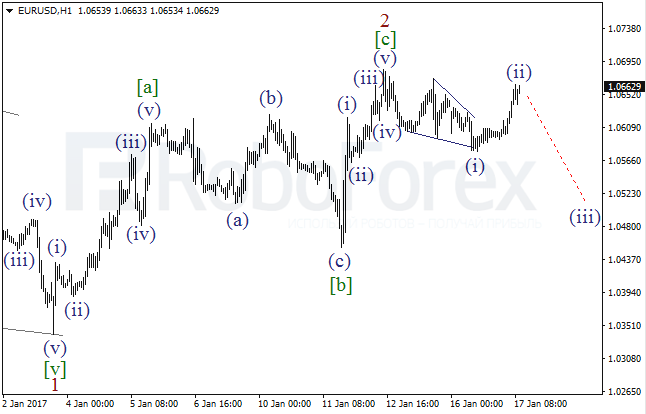
More detailed structure is shown on the H1 chart. It looks like yesterday the pair finished the descending wedge in the wave (i). Consequently, after completing the local correction, the market may start another decline in the wave (iii) of [i].
GBP USD, “Great Britain Pound vs US Dollar”
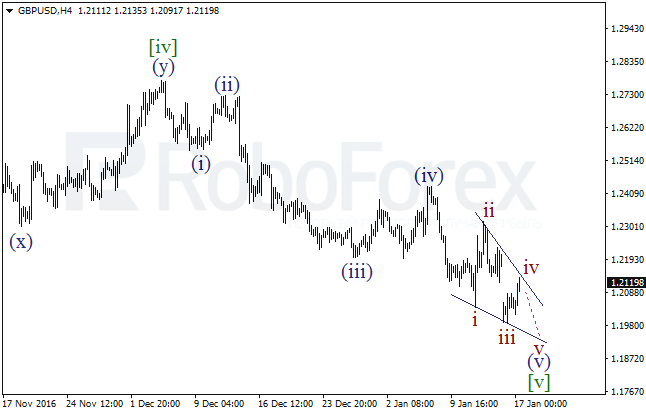
It’s highly likely that the GBP/USD pair is forming the wave (v) of [v] in the form of the diagonal triangle. On a shorter timeframe, the price is about to finish the fourth wave and may soon resume falling in the wave v of (v). after rebounding from the pattern’s downside border, the market may start an ascending correction.
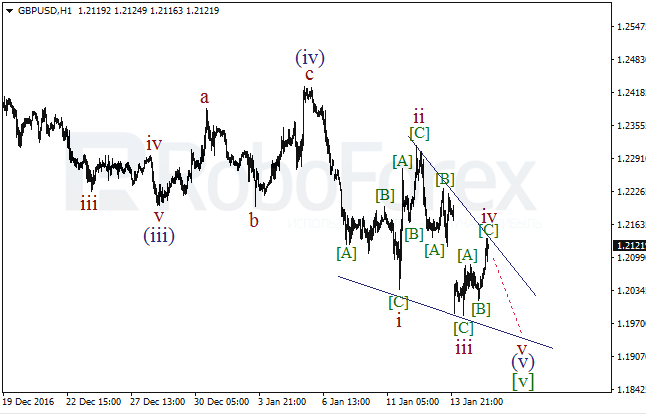
As we can see at the H1 chart, the wave iv is taking the form of the zigzag. Earlier, the price finished the descending zigzag in the wave iii. As a result, during the day the market may form another zigzag, this time in the wave v of (v).
USD JPY, “US Dollar vs Japanese Yen”
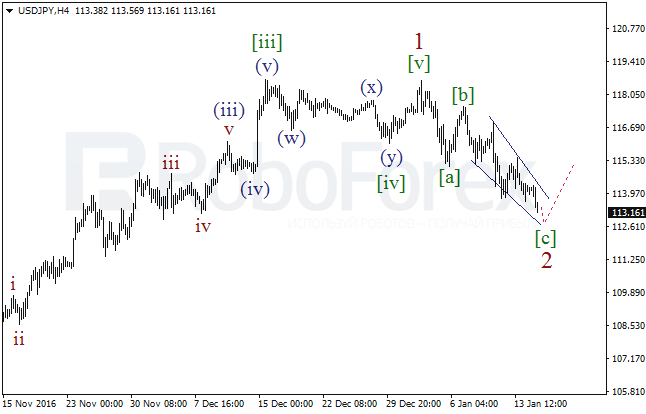
In case of the USD/JPY pair, the price is still forming the diagonal triangle in the wave [c] of 2. Earlier, the pair finished the bullish impulse 1 with the extended third wave. If the market rebounds from the above-mentioned pattern’s downside border, it may resume moving upwards.
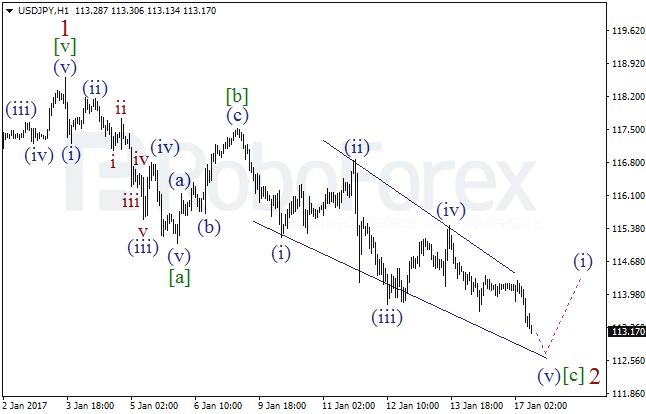
More detailed structure is shown on the H1 chart. It looks like the pair is finishing the fifth wave in the diagonal triangle. Consequently, in the nearest future the market may start growing in the wave (i).
AUD USD, “Australian Dollar vs US Dollar”
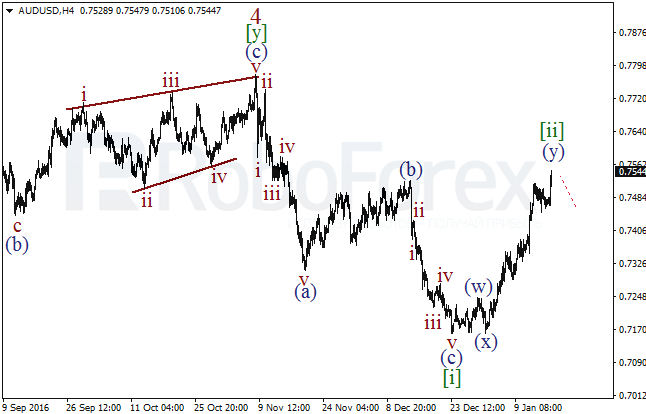
Probably, the AUD/USD pair finished the zigzag in the wave [i] of the diagonal triangle in the wave 5. Later, after completing the wave [ii] in the form of the double zigzag, the market may resume moving downwards.
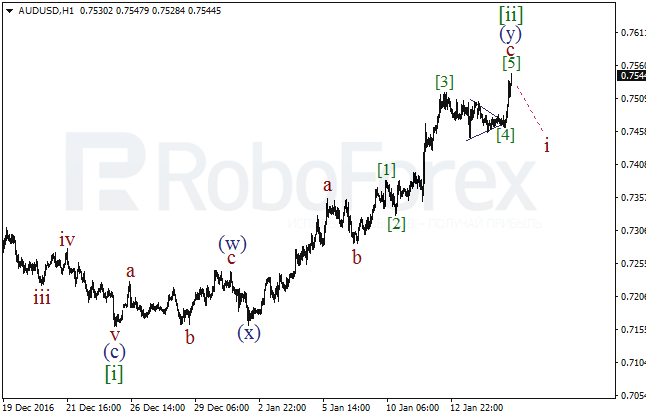
As we can see at the H1 chart, the pair is finishing the bullish impulse in the wave c of (y). Yesterday, the price completed the triangle in the wave [4] and started growing in the wave [5] of c. To confirm a new decline, the market has to form the descending impulse in the wave i.
RoboForex Analytical Department
Forecasts presented in this section only reflect the author’s private opinion and should not be considered as guidance for trading. RoboForex bears no responsibility for trading results based on trading recommendations described in these analytical reviews.