Wave Analysis 11.01.2017 (EUR/USD, GBP/USD, USD/JPY, AUD/USD)
Forecast for January 11th, 2017
EUR USD, “Euro vs US Dollar”
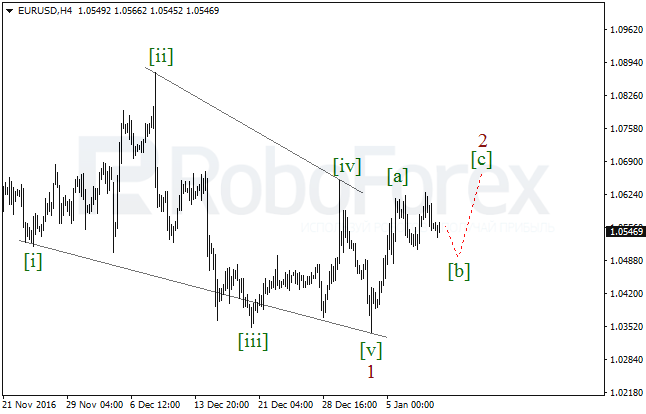
The EUR/USD pair is still being corrected. It looks like the price is forming the wave [b] in the zigzag2. As a result, in the nearest future the market may start a short-term growth in the wave [c] of 2.
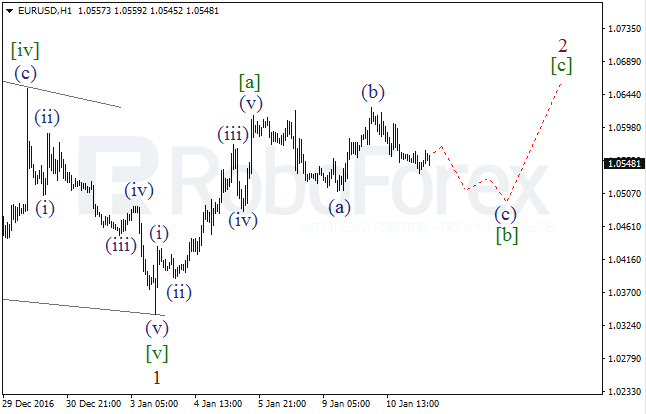
As we can see at the H1 chart, the wave [b] is taking the form of the flat. Consequently, later the market is expected to form the descending impulse in the wave (c) of [b] and break the local low.
GBP USD, “Great Britain Pound vs US Dollar”
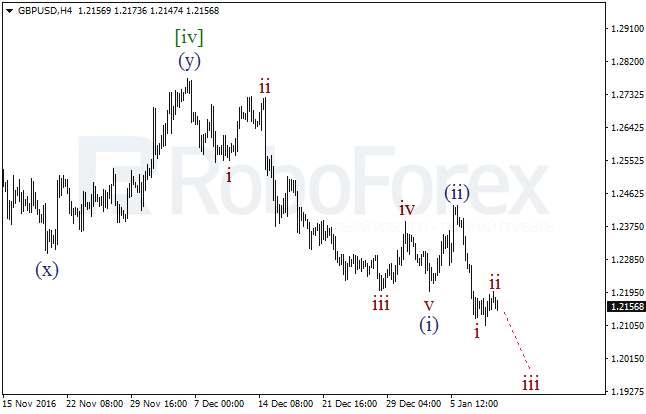
Probably, after finishing the descending impulse in the wave (i) and the correctional wave (ii), the GBP/USD pair completed the wave i and started another local correction. Consequently, in the nearest future the market may continue falling and forming the wave iii of (iii).
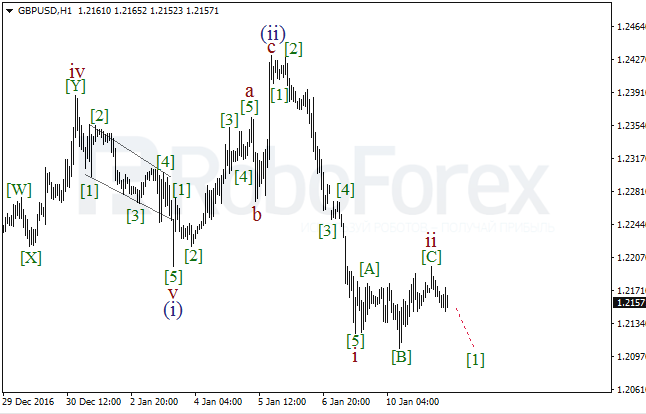
More detailed structure is shown on the H1 chart. It looks like the pair finished the descending impulse in the wave i along with the correctional flat in the wave ii. It’s highly likely that in the nearest future the market may form the descending wave [1] to confirm the wave iii of (iii).
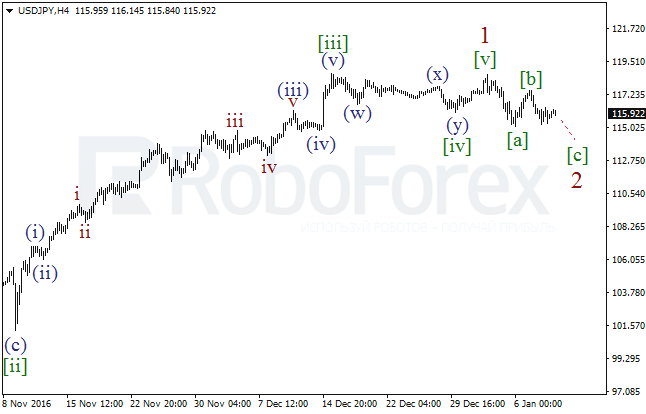
USD JPY, “US Dollar vs Japanese Yen”
Probably, after finishing the wave 1, the USD/JPY pair started another correction. Possibly, the wave 2 is taking the form of the zigzag. As a result, in the nearest future the market may continue forming the descending impulse in the wave [c] of 2.
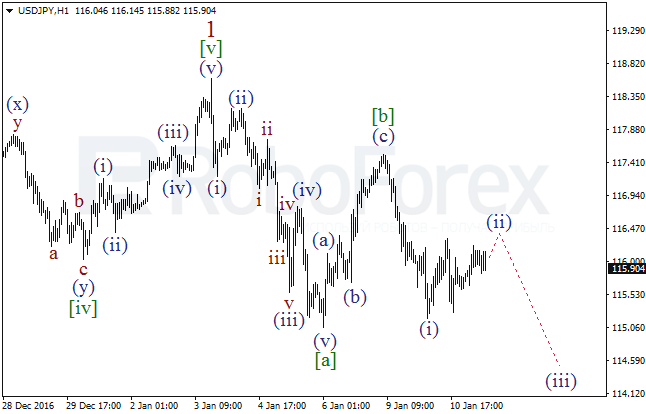
As we can see at the H1 chart, after finishing the wave [b] in the form of the zigzag, the pair formed the descending impulse in the wave (i). Consequently, after finishing the local correction, the market may resume falling and form the bearish impulse in the wave (iii) of [c].
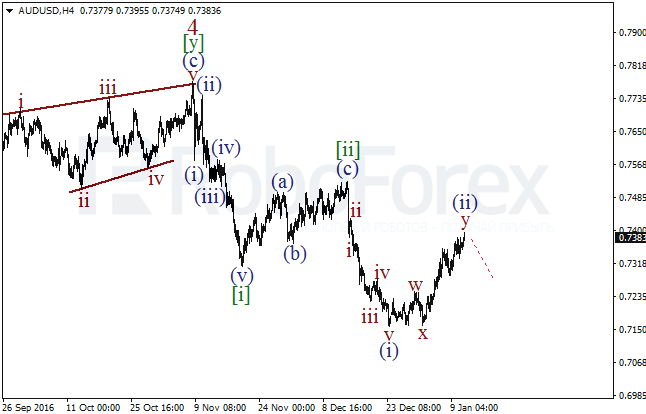
AUD USD, “Australian Dollar vs US Dollar”
In case of the AUD/USD pair, the price is still forming the wave (ii) in the form of the double zigzag. Earlier, the pair completed two descending impulses, [i] and (i). It’s highly likely that in the nearest future the market may resume moving downwards in the wave (iii) of [iii].
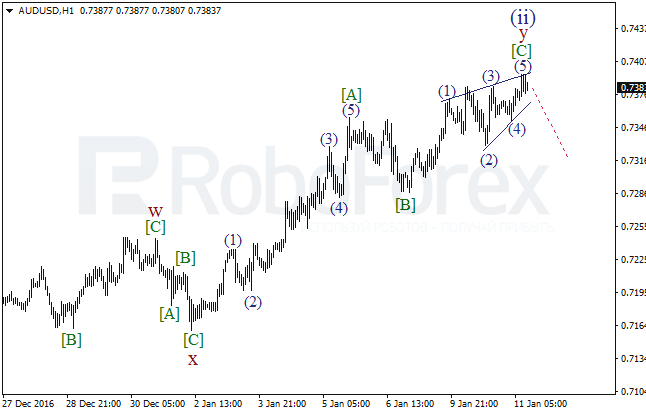
As we can see at the H1 chart, the pair probably finished the diagonal triangle in the wave [C] of y and, as a result, completed the wave (ii) as well. In this case, in the future the market may resume moving downwards in the third wave.
RoboForex Analytical Department
Forecasts presented in this section only reflect the author’s private opinion and should not be considered as guidance for trading. RoboForex bears no responsibility for trading results based on trading recommendations described in these analytical reviews.