Japanese Candlesticks Analysis 12.03.2015 (EUR/USD, USD/JPY)
12.03.2015
Analysis for March 12th, 2015
EUR USD, “Euro vs. US Dollar”
At the H4 chart of EUR USD, bearish Three Methods pattern indicates that the downtrend continues. The price has reached a long-term support area. Three Line Break chart and Heiken Ashi candlesticks confirm a descending movement.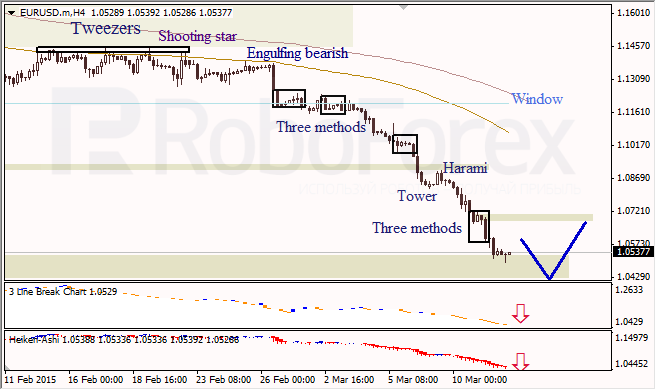
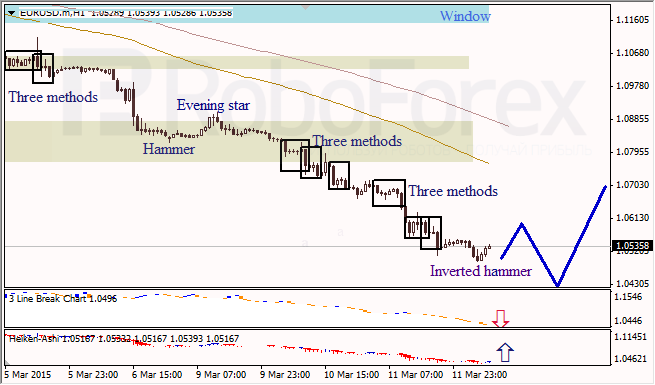
The H1 chart of EUR USD shows the downtrend. Three Line Break chart shows the downtrend; Inverted Hammer pattern and Heiken Ashi candlesticks confirm a possible ascending correction.
USD JPY, “US Dollar vs. Japanese Yen”
The H4 chart of USD JPY shows a descending correction, which is indicated by Tweezers, Shooting Star, and Engulfing Bearish reversal patterns. Three Line Break chart and Heiken Ashi candlesticks confirm that the correction may continue up to support from the closest Window.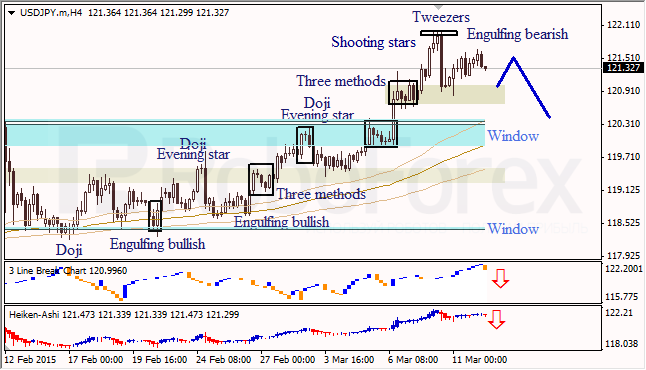
RoboForex Analytical Department
Attention!
Forecasts presented in this section only reflect the author’s private opinion and should not be considered as guidance for trading. RoboForex bears no responsibility for trading results based on trading recommendations described in these analytical reviews.