Japanese Candlesticks Analysis 12.02.2015 (EUR/USD, USD/JPY)
12.02.2015
Analysis for February 12th, 2015
EUR USD, “Euro vs. US Dollar”
The H4 chart of EUR USD shows the downtrend, which continues after Shooting Star and Tweezers reversal patterns. Three Methods continuation pattern indicates that the pair may continue falling. Three Line Break chart and Heiken Ashi candlesticks confirm a correction.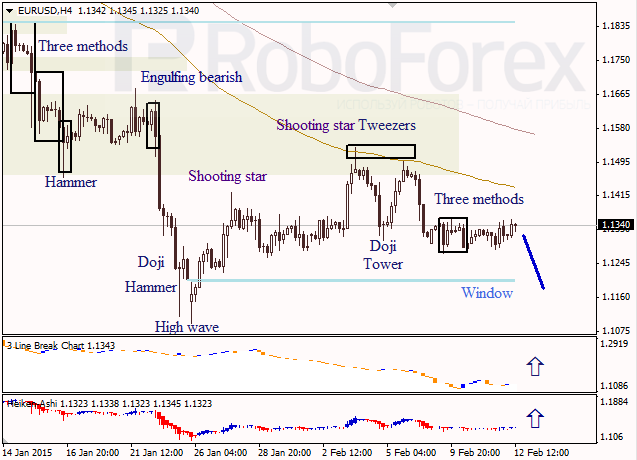
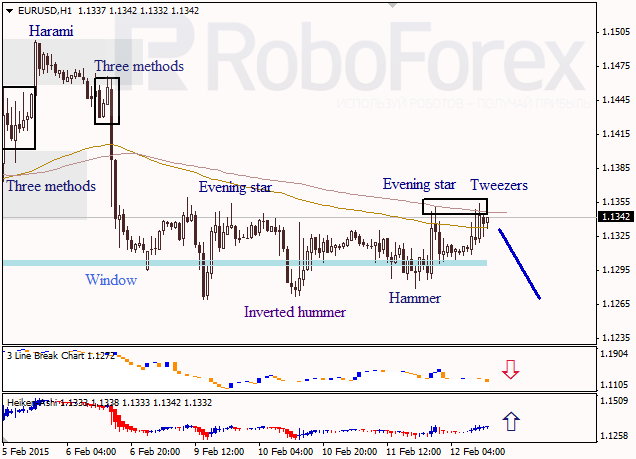
As we can see at the H1 chart of EUR USD, after finishing Evening Star and Tweezers patterns near the Moving Average, the price may resume falling. Three Line Break chart and Heiken Ashi candlesticks show different directions.
USD JPY, “US Dollar vs. Japanese Yen”
At the H4 chart of USD JPY, we can see that after forming Evening Star pattern near the closest Window, the price is being corrected. Hammer pattern may indicate that the pair may resume growing, but it hasn’t been confirmed yet by Heiken Ashi candlesticks.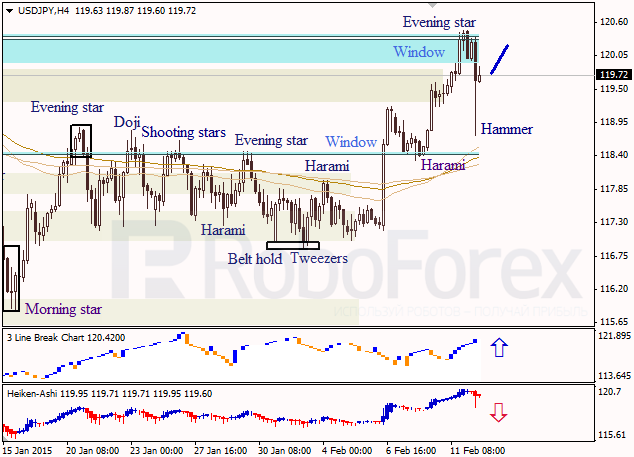
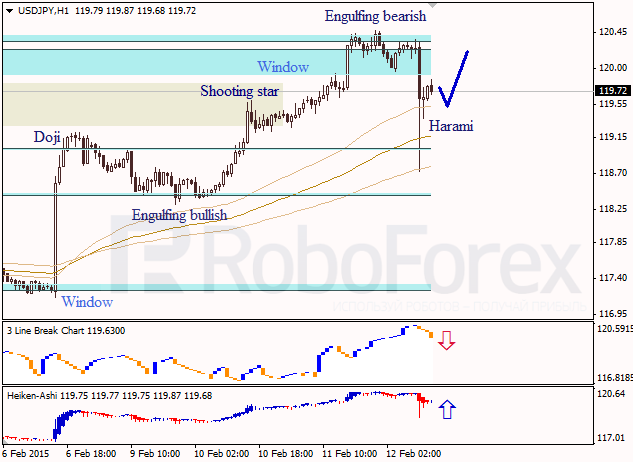
As we can see at the H1 chart of USD JPY, the pair has formed Harami pattern near the closest Window. Possibly, in the nearest future the price may form a pullback towards the upper Window, after which Three Line Break chart and Heiken Ashi candlesticks will reverse upwards.
RoboForex Analytical Department
Attention!
Forecasts presented in this section only reflect the author’s private opinion and should not be considered as guidance for trading. RoboForex bears no responsibility for trading results based on trading recommendations described in these analytical reviews.