Japanese Candlesticks Analysis 08.12.2014 (EUR/USD, USD/JPY)
08.12.2014
Analysis for December 8th, 2014
EUR USD, “Euro vs. US Dollar”
The H4 chart of EUR USD shows the downtrend, which continued after a bearish Harami pattern near the resistance level. Three Line Break chart and Heiken Ashi candlesticks confirm a bearish movement.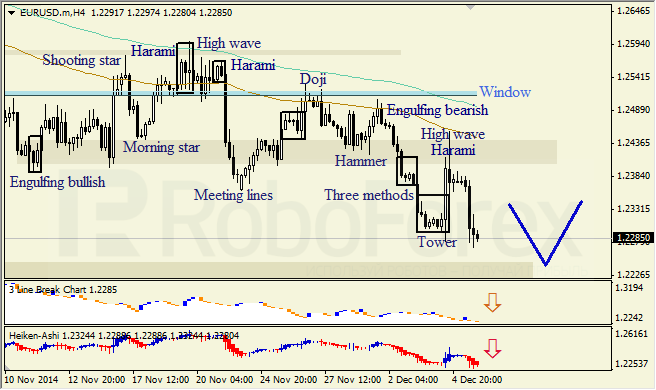
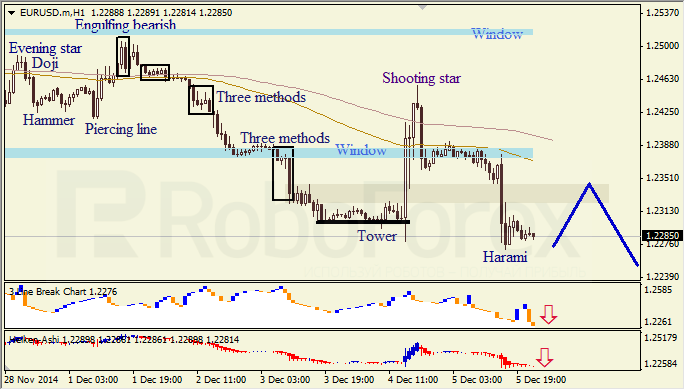
The H1 chart of EUR USD shows an ascending correction, which is indicated by a bullish Harami pattern. Three Line Break chart and Heiken Ashi candlesticks confirm the downtrend.
USD JPY, “US Dollar vs. Japanese Yen”
At the H4 chart of USD JPY, the price is “slowing down” – the candlesticks are getting shorter within the uptrend, which means that the pair may start a new correction soon. Three Line Break chart and Heiken Ashi candlesticks confirm an ascending movement.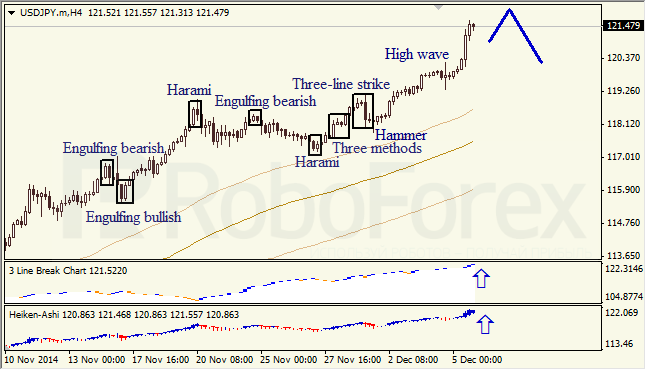
RoboForex Analytical Department
Attention!
Forecasts presented in this section only reflect the author’s private opinion and should not be considered as guidance for trading. RoboForex bears no responsibility for trading results based on trading recommendations described in these analytical reviews.