Fibonacci Retracements Analysis 16.08.2017 (GBP/USD, EUR/JPY)
GBP USD, “Great Britain Pound vs US Dollar”
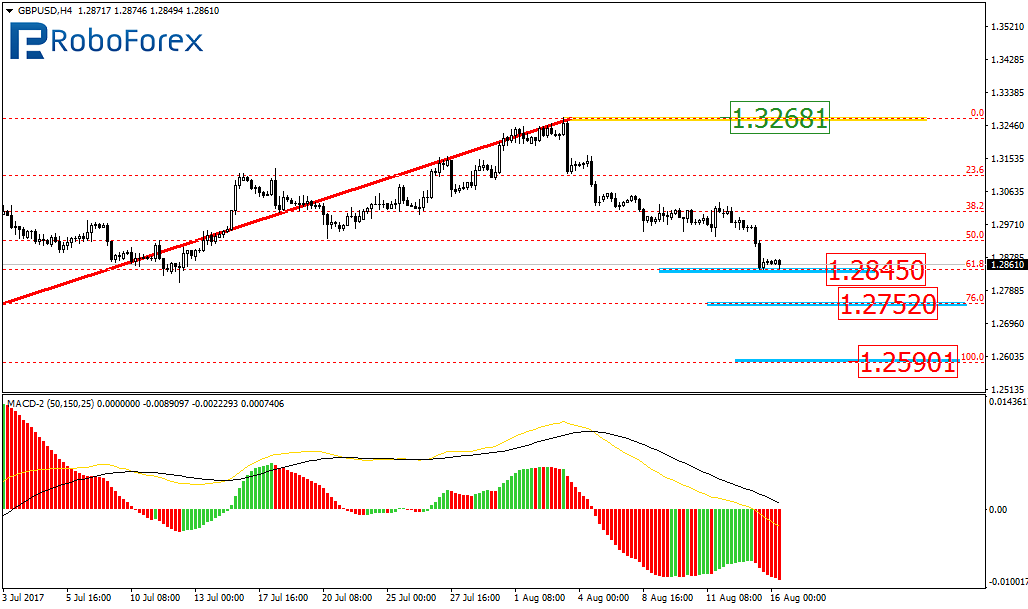
As we can see at the H4 chart, the descending correction has reached the retracement of 61.8%. The next targets of this correction may be the retracements of 76.0% at 1.2753. The more “ambitious” target of this decline may be the local low at 1.2590.
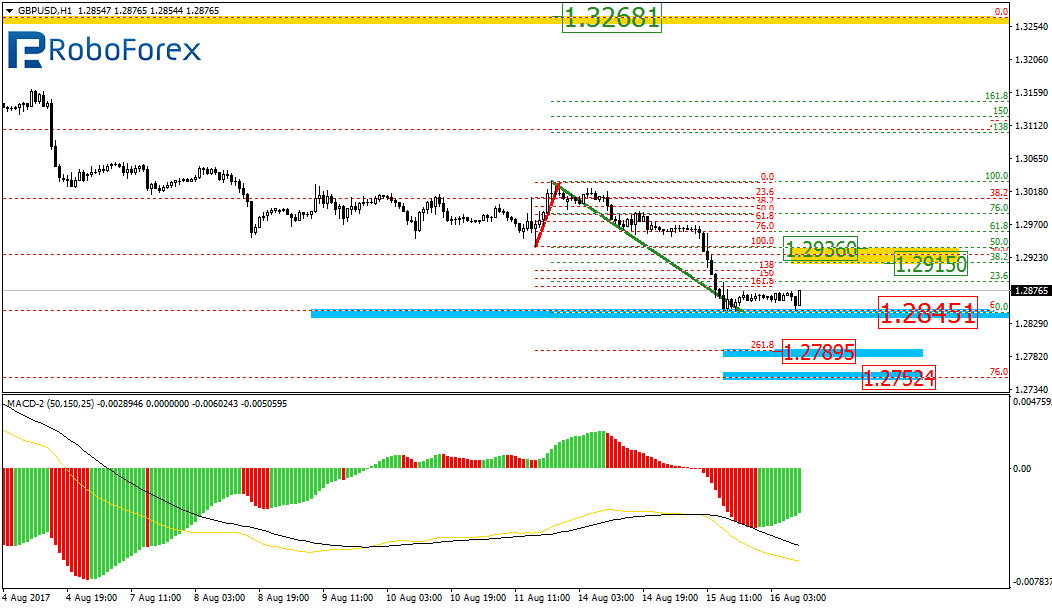
At the H1 chart, the situation is pretty the same. The pair is correcting the previous descending impulse. The target of such correction is the retracements of 38.2% and 50.0% at 1.2915 and 1.2936 respectively. After breaking the local low at 1.2845, the price may continue falling inside the downtrend to reach its next targets at 1.2789 and 1.2752.
EUR JPY, “Euro vs. Japanese Yen”
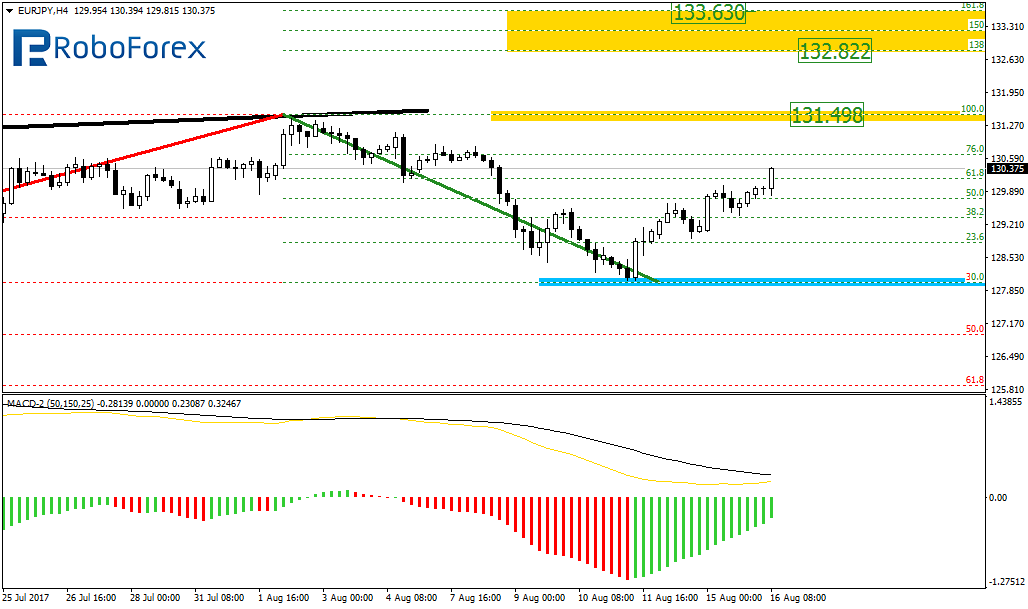
At the H4 chart of the EUR/JPY pair, after being corrected to the downside by 38.2%, the price started forming a new ascending impulse. The closest upside target is the local high at 131.49. If the price breaks it, the pair may continue growing towards the retracements of 138.2% – 161.8% (132.82 – 133.63).
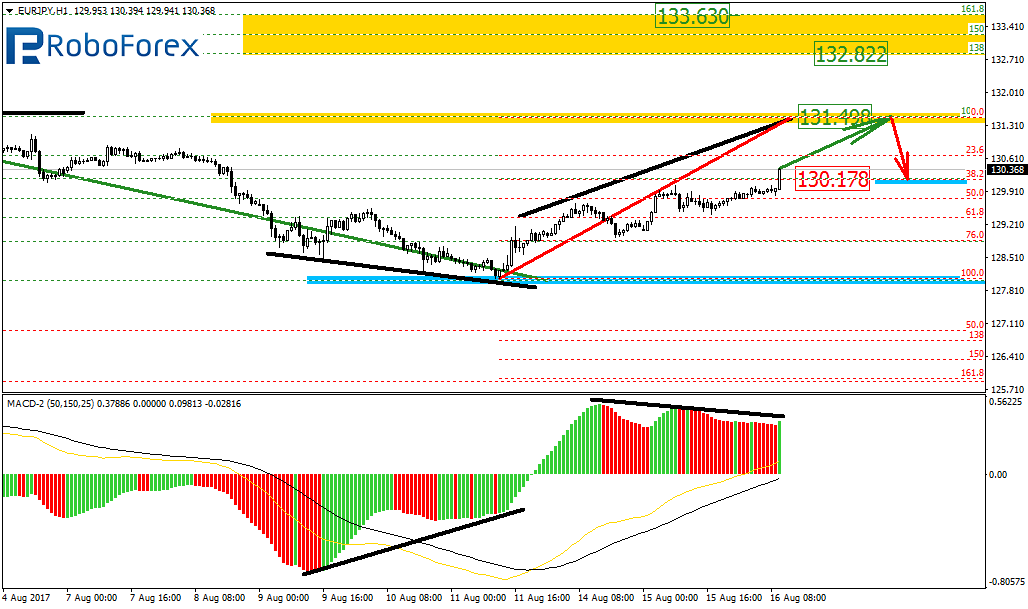
At the H1 chart, the situation is pretty similar. The price is forming the ascending impulse towards the local high at 131.49. However, we can see the divergence, which may indicate a possible reverse at the above-mentioned level.
RoboForex Analytical Department
Forecasts presented in this section only reflect the author’s private opinion and should not be considered as guidance for trading. RoboForex bears no responsibility for trading results based on trading recommendations described in these analytical reviews.