Japanese Candlesticks Analysis 22.09.2017 (USD/CAD, XAU/USD)
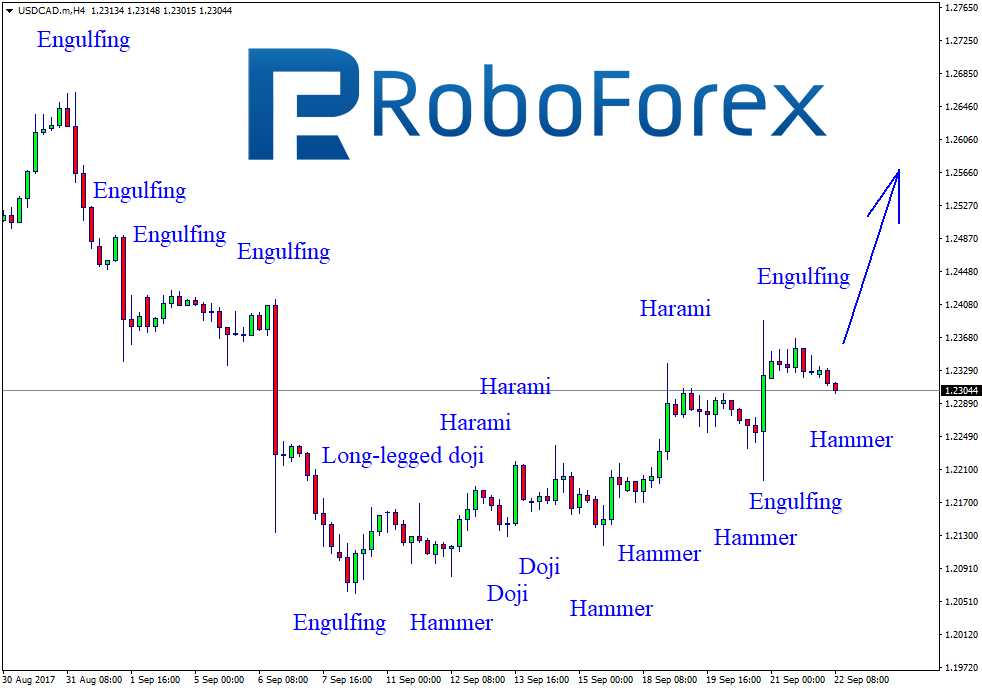
USD CAD, “US Dollar vs Canadian Dollar”
At the H4 chart, the USD/CAD pair continues growing and forming the ascending channel with Long-Legged Doji, Hammer, Doji, Harami, and Engulfing reversal patterns at support and resistance levels to define its borders. Right now, after finishing another pullback, the pair is trading close to the support level at 1.2300. Later, the instrument is expected to form Hammer pattern continue growing towards the resistance level at 1.2455.
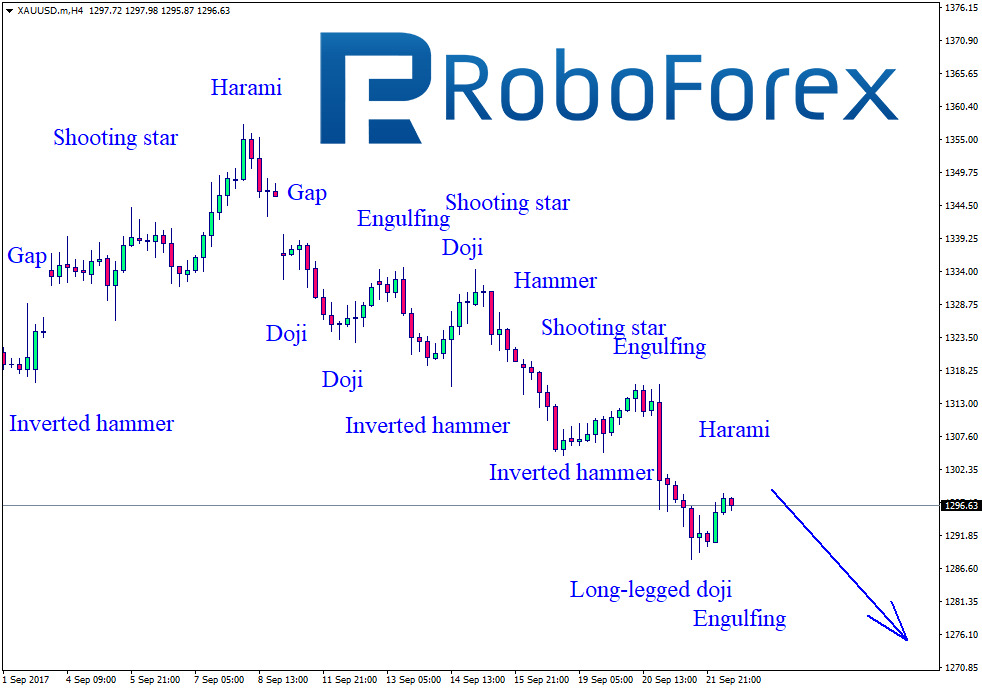
XAU USD, “Gold vs US Dollar”
As we can see at the H4 chart, the instrument continues forming the descending channel with Gap, Engulfing, Shooting Star, Doji, Hammer, and Inverted Hammer patterns to define its borders. The price reached the support level at 1290.50 where it formed Long-Legged Doji and Engulfing patterns, which indicate another correction towards the upside border of the descending channel. After completing this correction, the price may move to reach the support level at 1285.00.
RoboForex Analytical Department
Forecasts presented in this section only reflect the author’s private opinion and should not be considered as guidance for trading. RoboForex bears no responsibility for trading results based on trading recommendations described in these analytical reviews.