Japanese Candlesticks Analysis 19.09.2017 (USD/CAD, XAU/USD)
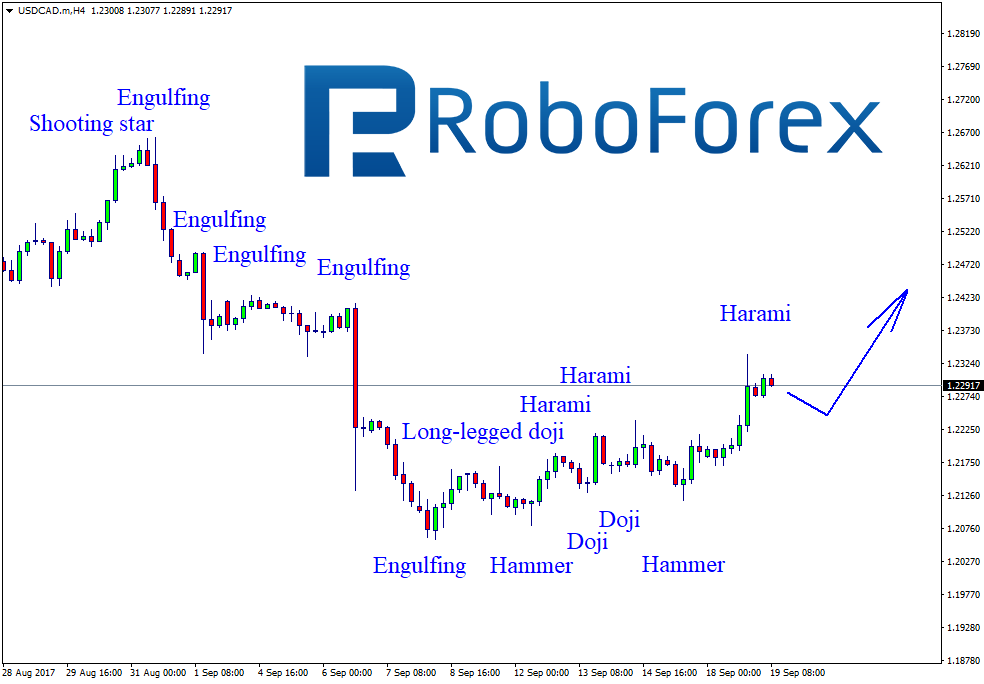
USD CAD, “US Dollar vs Canadian Dollar”
At the H4 chart, the USD/CAD pair continues growing and forming Hammer, Long-Legged Doji, and Harami reversal patterns to define the borders of the ascending channel. Right now, the pair is being corrected again and forming Harami pattern. The current upside target is at the closest resistance level at 1.2404.
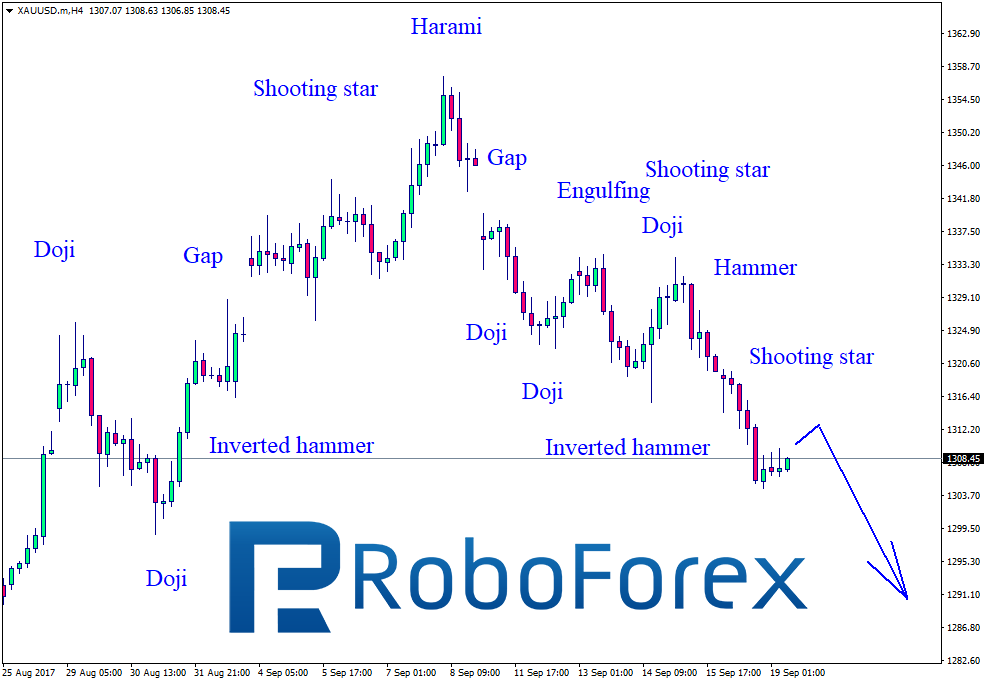
XAU USD, “Gold vs US Dollar”
As we can see at the H4 chart, Gap, Shooting Star, Doji, Hammer, and Inverted Hammer patterns formed at both support and resistance levels have defined the borders of the descending channel. After reaching another target, the pair has been corrected with two Shooting Star patterns at the top. The next downside target is at the next support level at 1290.50.
RoboForex Analytical Department
Forecasts presented in this section only reflect the author’s private opinion and should not be considered as guidance for trading. RoboForex bears no responsibility for trading results based on trading recommendations described in these analytical reviews.