Detalization of descending zigzag. XAU/USD wave analysis.
23.07.2014
Analysis for July 23rd, 2014
In our previous review, “Completion of descending zigzag. Wave analysis of XAU/USD for 21.07.2014”, we discussed possible scenario how the price may form descending correction [B] of e of (iv).
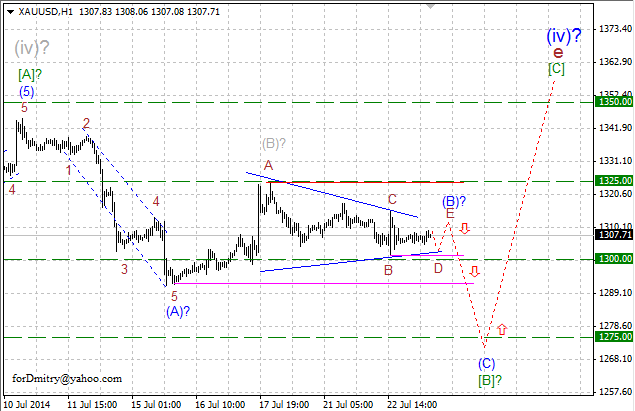
At H1 chart, price is probably completing horizontal running triangle(B) of [B] and later may continue forming final wave (C) of [B] of zigzag[B] of e of (iv) towards level of ~1275.
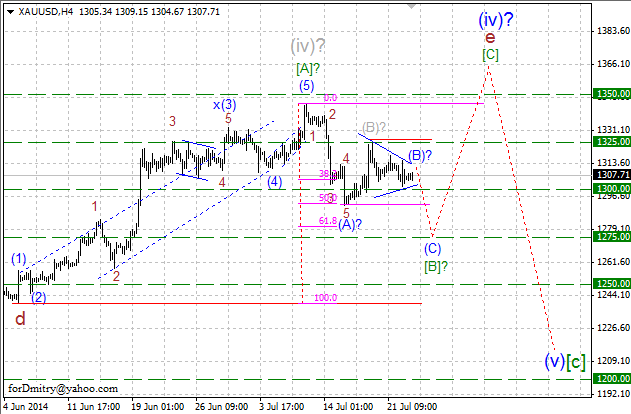
Wave structure at the H4 chart implies that inside ascending zigzage of (iv), the price is forming local descending correction [B] of e of (iv), maybe in the form of zigzag, towards support level at ~1275. Right now, the pair is expected to start forming its final “leg” (C) of [B] of e of (iv).
However, at the same time one should remember that any possible scenario is subjective and the market may move in a completely different direction.
RoboForex Analytical Department
Attention!
Forecasts presented in this section only reflect the author’s private opinion and should not be considered as guidance for trading. RoboForex bears no responsibility for trading results based on trading recommendations described in these analytical reviews.