Wave Analysis 01.09.2014 (DJIA Index, Crude Oil)
01.09.2014
Analysis for September 1st, 2014
DJIA Index
Probably, Index continues forming diagonal triangle inside wave 5 of (3). On lower levels, the price is about to complete an ascending impulse wave (A). We should note, that an oncoming correction inside wave (B) might turn out to be quite deep, so one is not recommended to open any buy orders for a while after this correction starts.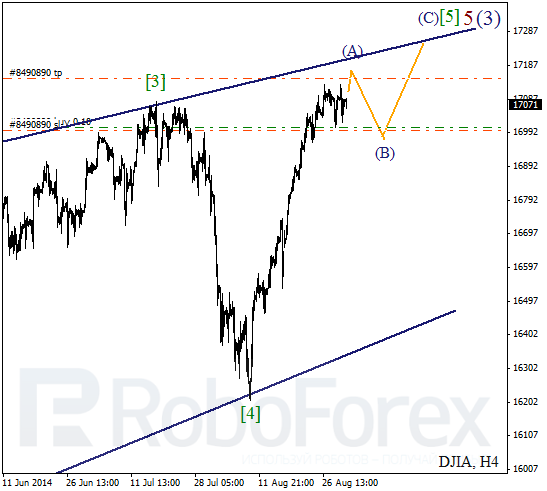
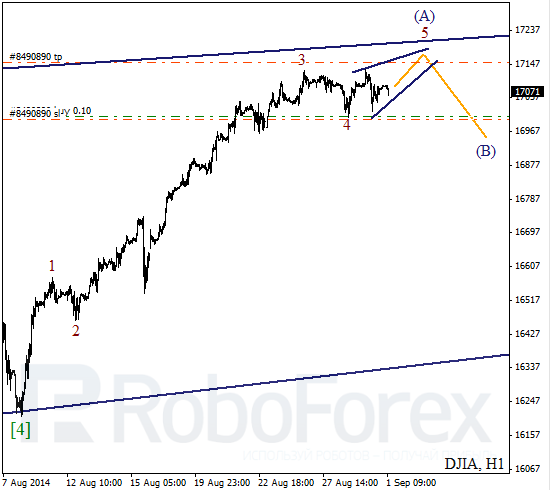
More detailed wave structure is shown on H1 chart. Possibly, in the end of wave (A), bulls decided to form diagonal triangle inside the fifth wave. If this assumption is correct, then later the price may reach several new maximums and then start a new correction.
Crude Oil
Oil continues falling inside a descending channel and extending wave 3. Probably, on lower levels the price is finishing the fourth wave. Consequently, if bears take the opportunity to and rebound from the channel’s upper border, it will be a signal for a new descending movement inside the fifth wave.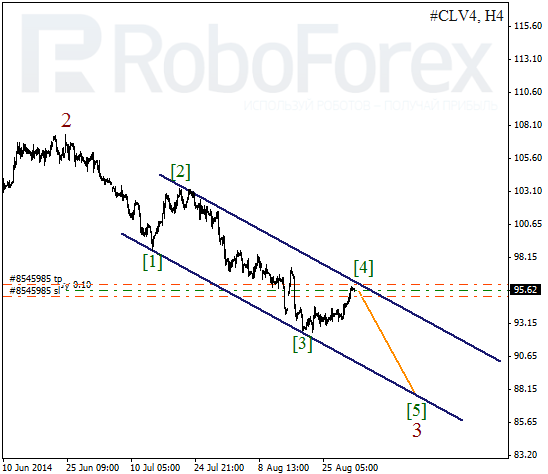
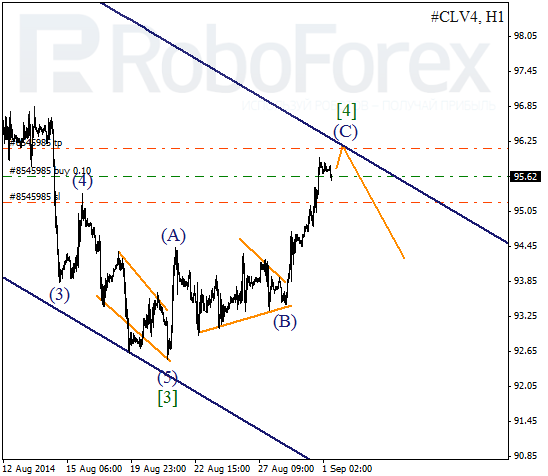
As we can see at the H1 chart, wave [4] is taking the form of zigzag. On lower levels, after a long triangle inside wave (B), the pair is finishing an ascending impulse inside wave (C). In the near term, the instrument may make a local ascending movement and break the previous maximum near the channel’s border.
RoboForex Analytical Department
Attention!
Forecasts presented in this section only reflect the author’s private opinion and should not be considered as guidance for trading. RoboForex bears no responsibility for trading results based on trading recommendations described in these analytical reviews.