Japanese Candlesticks Analysis 29.07.2014 (EUR/USD, USD/JPY)
29.07.2014
Analysis for July 29th, 2014
EUR USD, “Euro vs US Dollar”
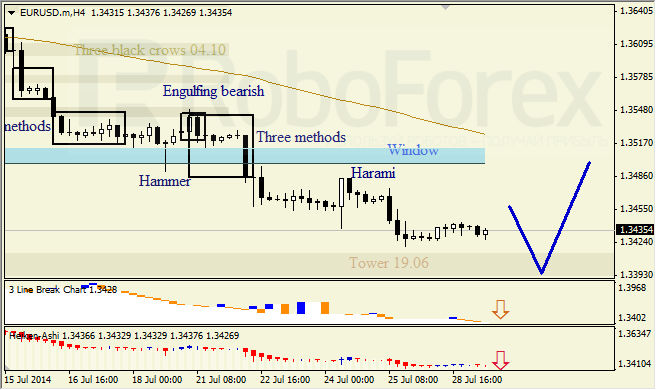
H4 chart of EUR USD shows descending trend. Tower level from 19.06 is the support level. Three Line Break chart and Heiken Ashi candlesticks confirm bearish movement.
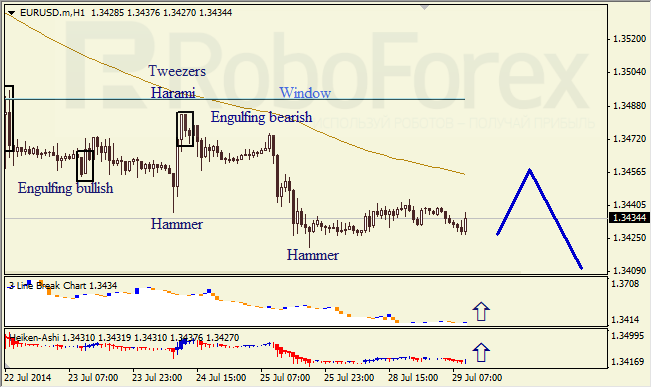
H1 chart of EUR USD shows sideways correction within descending trend. Hammer, Three Line Break chart and Heiken Ashi candlesticks confirm correction to the upside.
H1 chart of EUR USD shows sideways correction within descending trend. Hammer, Three Line Break chart and Heiken Ashi candlesticks confirm correction to the upside.
USD JPY, “US Dollar vs Japanese Yen”
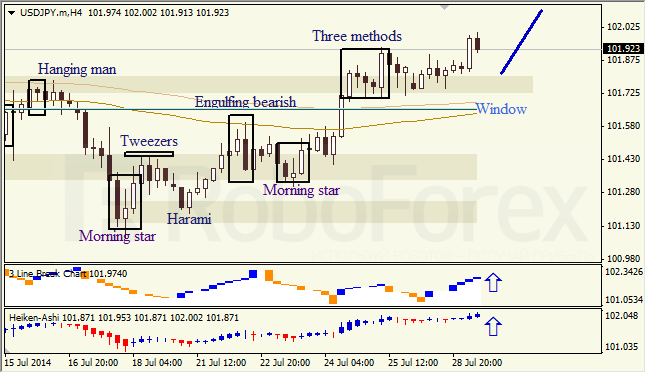
At H4 chart of USD JPY, we can see bullish tendency. Three Line Break chart and Heiken Ashi candlesticks confirm ascending movement.
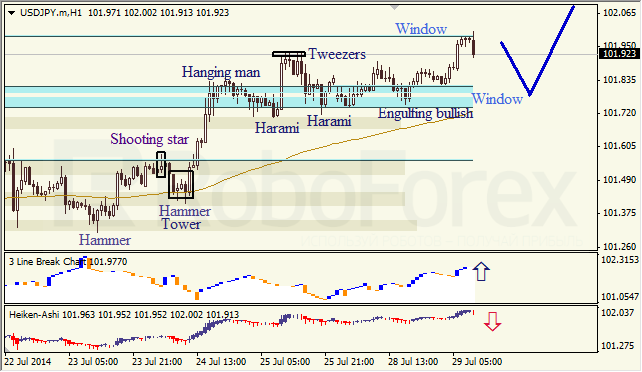
H1 chart of USD JPY shows ascending trend. Upper Window is the resistance level. Three Line Break chart and Heiken Ashi candlesticks confirm bearish correction.
RoboForex Analytical Department
H1 chart of USD JPY shows ascending trend. Upper Window is the resistance level. Three Line Break chart and Heiken Ashi candlesticks confirm bearish correction.
RoboForex Analytical Department
Attention!
Forecasts presented in this section only reflect the author’s private opinion and should not be considered as guidance for trading. RoboForex bears no responsibility for trading results based on trading recommendations described in these analytical reviews.