Murrey Math Lines 22.05.2019 (USDJPY, USDCAD)
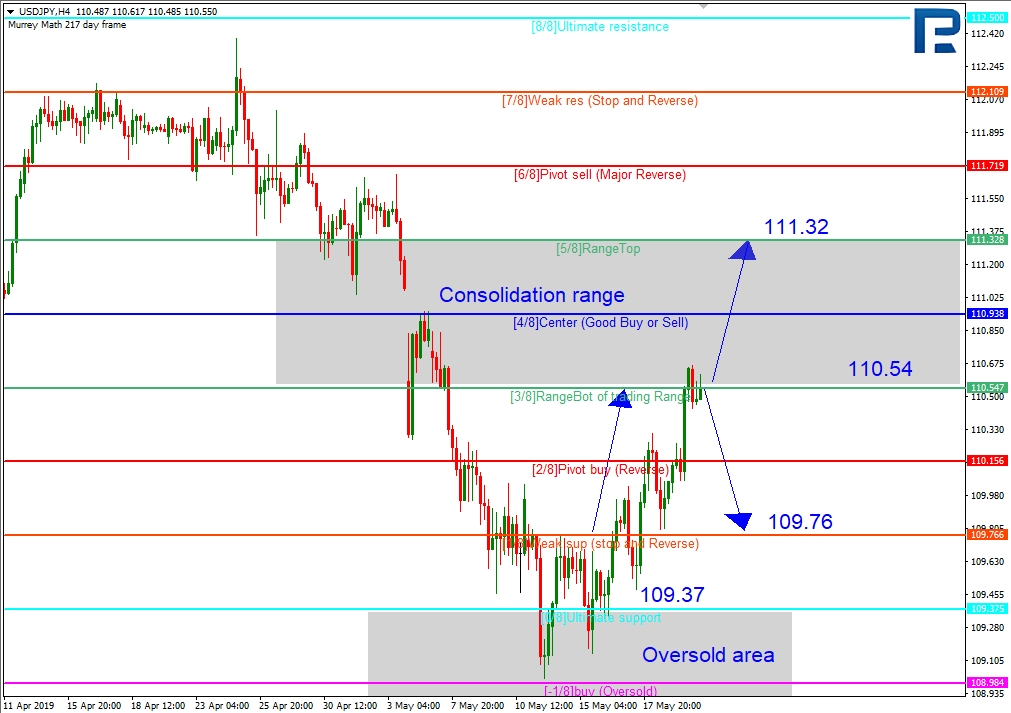
USDJPY, “US Dollar vs. Japanese Yen”
As we can see in the H4 chart, USDJPY has reached the target at the 3/8 level, just as expected. The major tendency is still descending, that’s why this growth may be considered as a correction, which may be followed by a new wave to the downside. So, in this case, the main scenario implies that the pair may rebound from the 3/8 level and start a new decline to reach the support at the 1/8 one. However, this scenario will no longer be valid if the instrument breaks the 3/8 level. After that, the pair may resume trading upwards with the target at the 5/8 level.

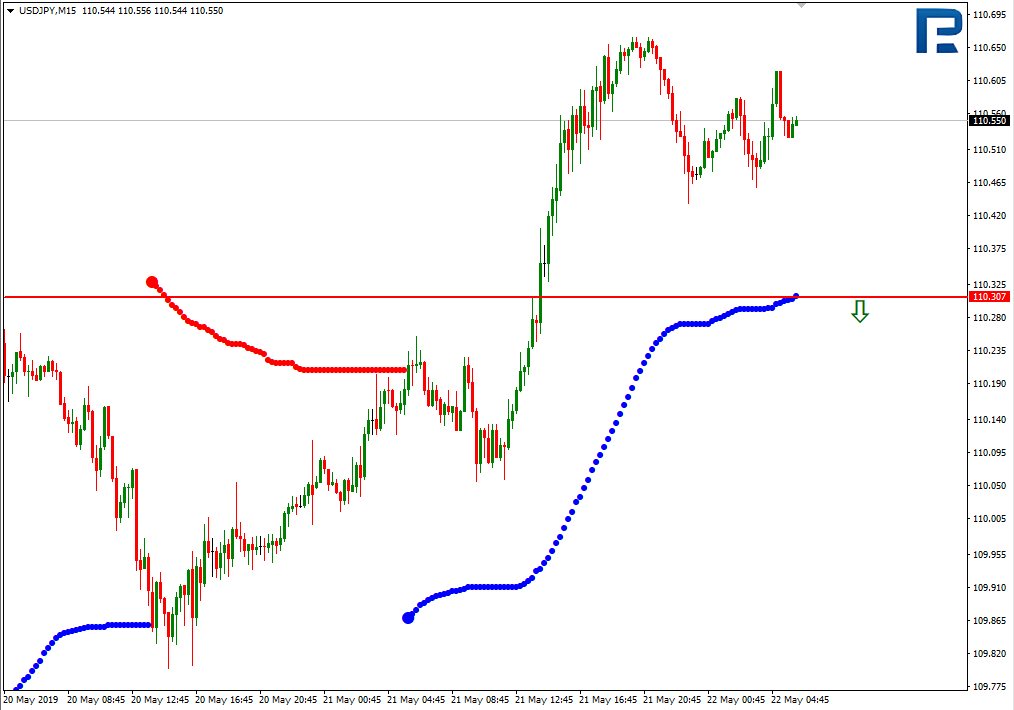
In the M15 chart, the pair may break the downside line of the VoltyChannel indicator and, as a result, continue trading downwards.
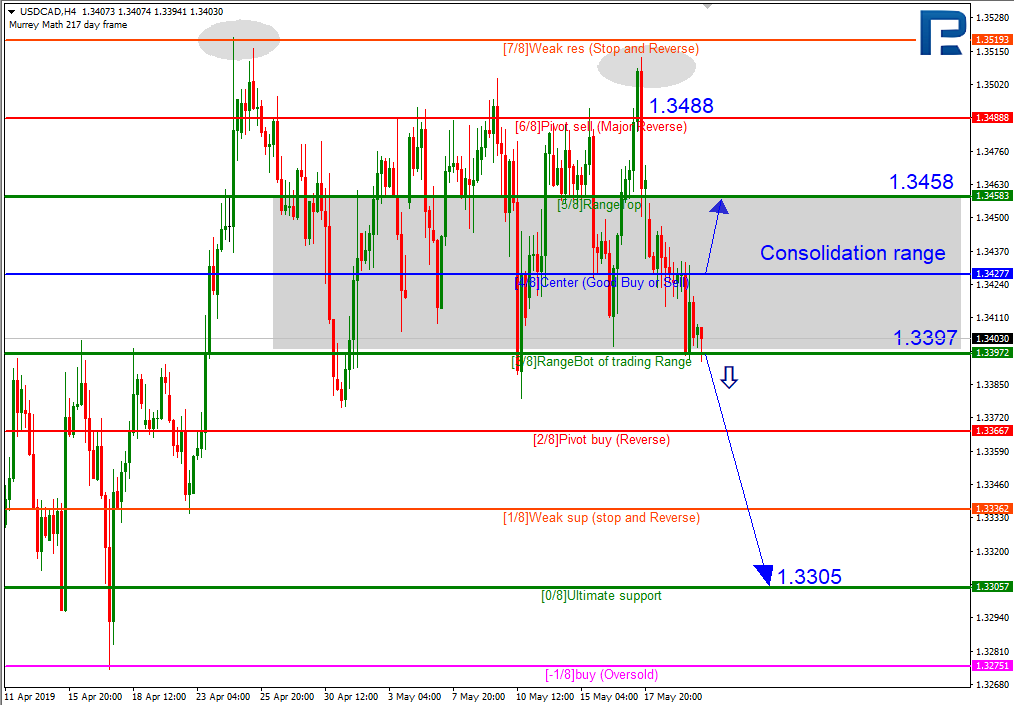
USDCAD, “US Dollar vs Canadian Dollar”
As we can see in the H4 chart, USDCAD has been trading in the range between the 3/8 and 6/8 levels for about a month. At first thought, it seems like the pair is “gathering strength” before starting a strong movement in one of the directions, but the Murrey Lines suggest that this possible movement will be to the downside. On April 24th, the price was skyrocketing and then suddenly stopped by the intermediate resistance at the 7/8 level. If such a strong movement is stopped by this level, it indicates that the ascending tendency is rather weak and may soon reverse downwards to reach the 0/8 one. The price did reverse, but not as quickly as the Murrey Lines suggested. Then traders attempted to push the pair upwards one more time to try to continue the ascending tendency that existed at that moment, but it stopped again, this time at the 6/8 level. It means that market players were ready to buy USDCAD at lower prices, but then they refused to support the ascending tendency and just waited for new investors for making profit at their expense. In other words, they induce the pair to grow in order to attract other traders’ attention to it. However, this scheme fails quite often and the instrument reverses and starts falling again. In their last attempt, they succeeded to keep the price above the 6/8 level for a while, but then the pair plunged. On that basis, we may conclude that if the price breaks the 3/8 level, the pair may fall to reach the support at the 0/8 again. However, this scenario may be cancelled if the instrument breaks the 4/8 level. In this case, the pair may continue trading upwards to reach the resistance at the 5/8 one.
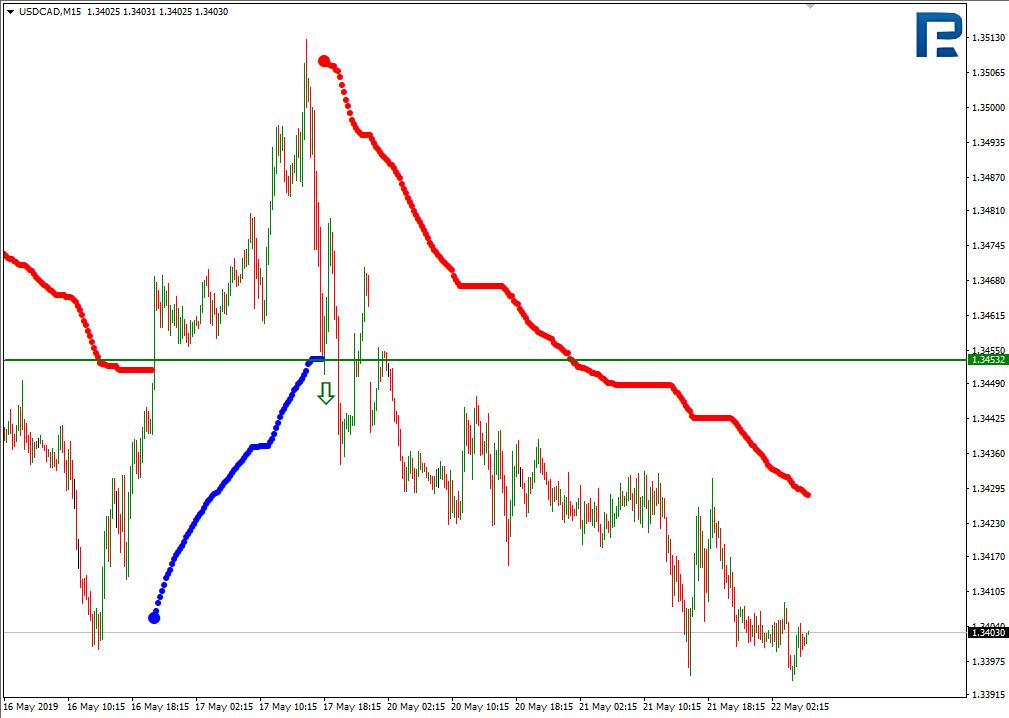
As we can see in the M15 chart, the pair has broken the downside line of the VoltyChannel indicator and, as a result, may continue trading downwards.
Forecasts presented in this section only reflect the author’s private opinion and should not be considered as guidance for trading. RoboForex bears no responsibility for trading results based on trading recommendations described in these analytical reviews.