Murrey Math Lines 08.05.2019 (USDJPY, USDCAD)
USDJPY, “US Dollar vs. Japanese Yen”
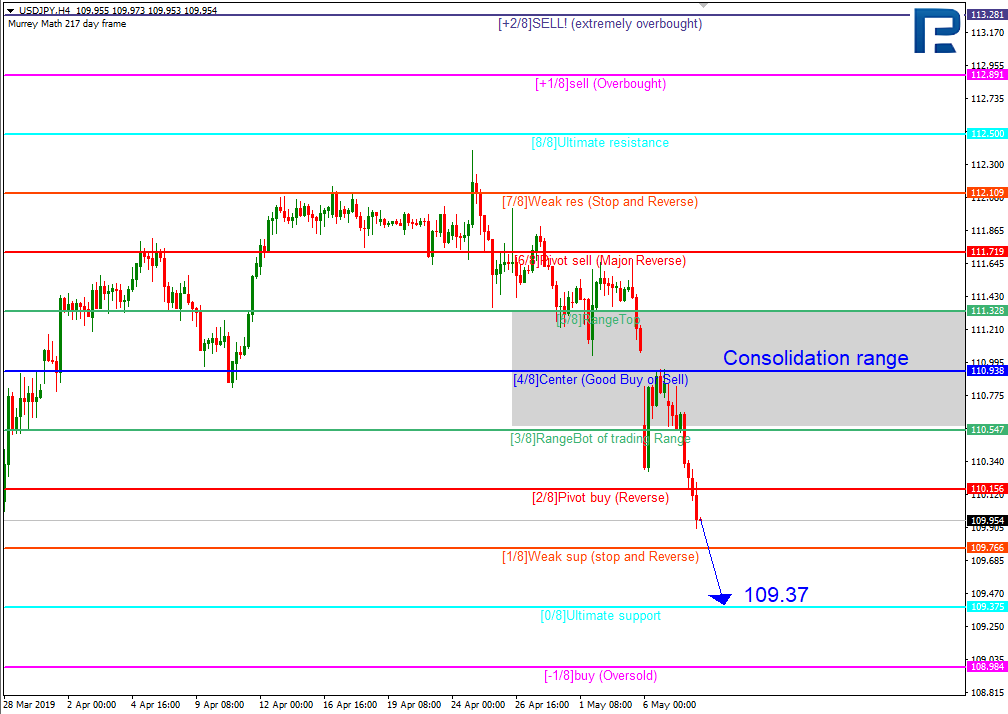
As we can see in the H4 chart, USDJPY is no longer consolidating; right now, it is moving downwards to reach the support at the 0/8 level.

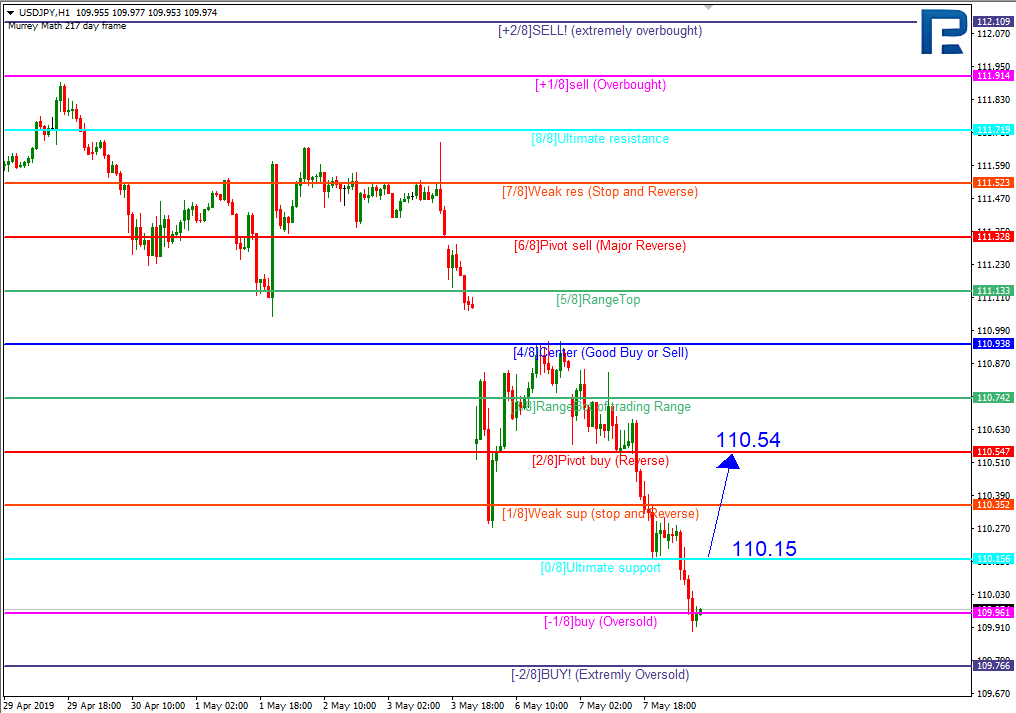
However, in the H1 chart the scenario is a bit different. If the pair breaks the 0/8 level, the price may start a short-term correction to reach the 2/8 one. Otherwise, the instrument may break the -2/8 level. In this case, the lines in the chart will be redrawn.
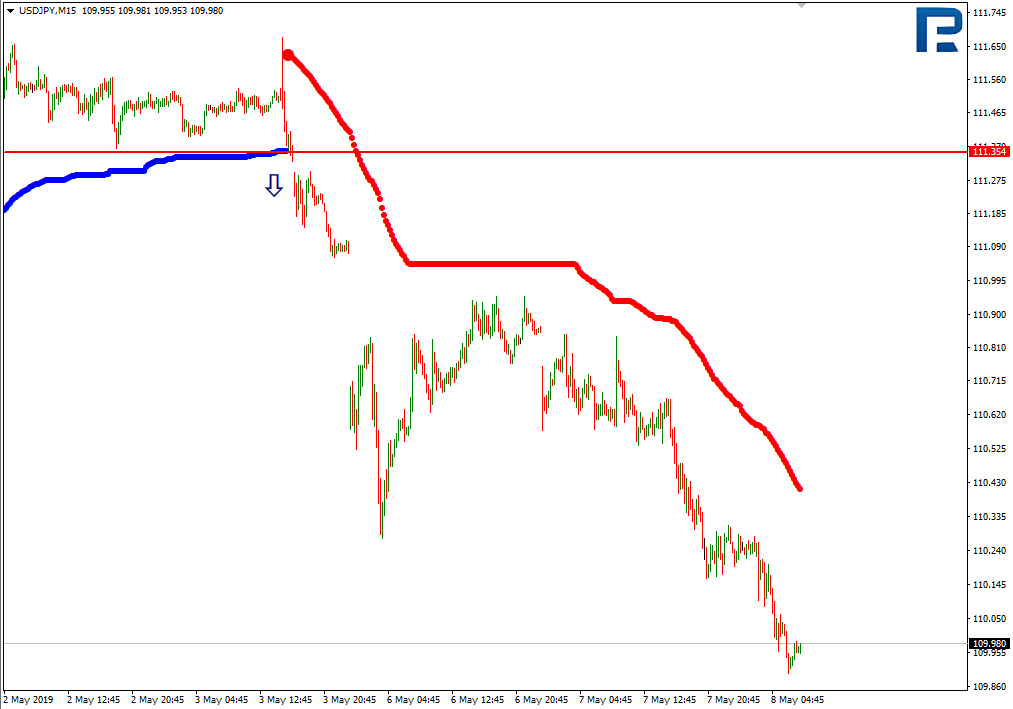
As we can see in the M15 chart, the pair has broken the downside line of the VoltyChannel indicator and, as a result, may continue trading downwards.
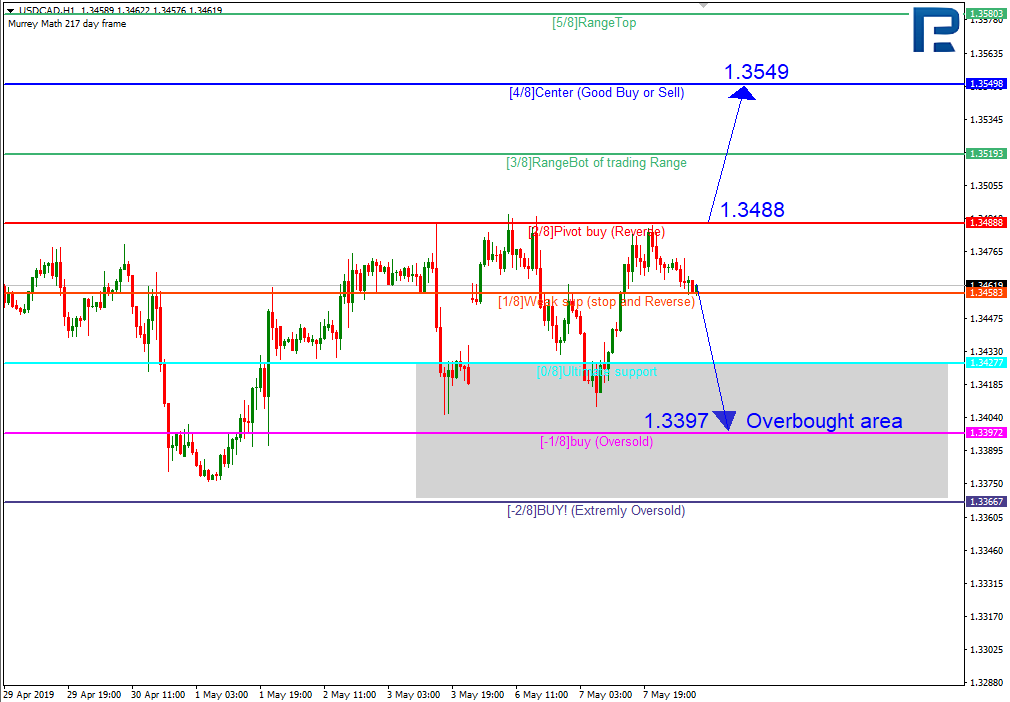
USDCAD, “US Dollar vs Canadian Dollar”
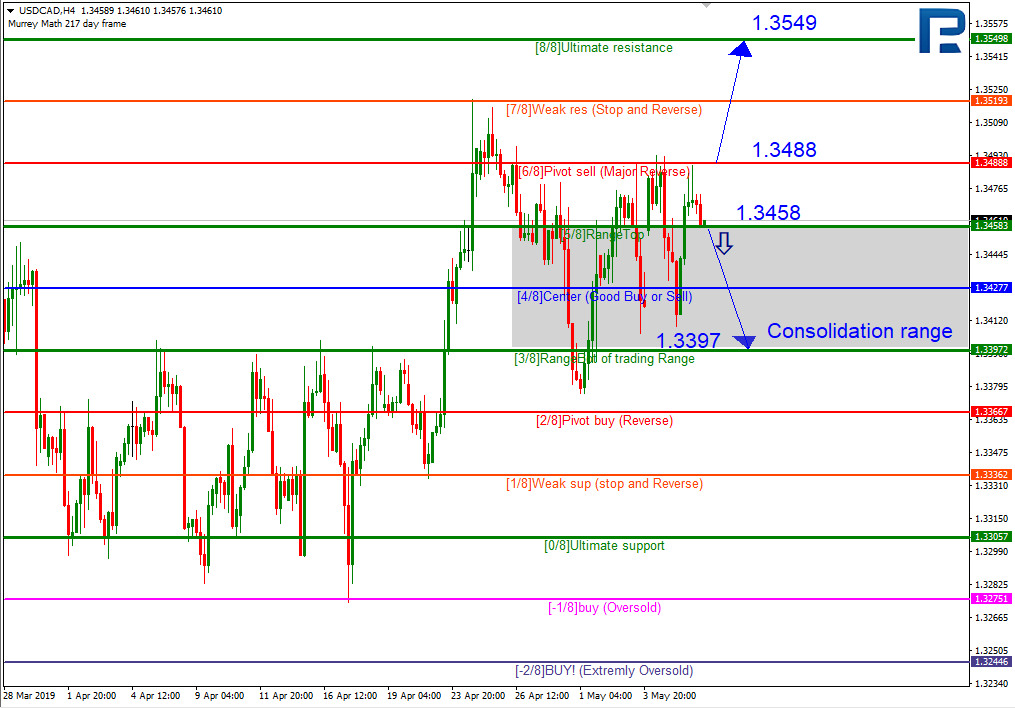
In the H4 chart, USDCAD is extremely volatile, that’s why it is breaking the borders of its consolidation range over and over again. Over the last several days, there has been a strong resistance at the 6/8 level, which may indicate a possible descending tendency. To start the tendency, the pair must break the 5/8 level; in this case, the first target will be at the 3/8 one. However, this scenario may be cancelled if the instrument breaks the 6/8 level. After that, the pair may resume trading upwards to reach the 8/8 one.
As we can see in the H1 chart, the pair is no longer trading inside the “oversold zone”, thus indicating a possible ascending tendency, which is, unfortunately, against the main scenario for the H4 chart. In this case, the price may start a new growth with the target at the 4/8 level only after breaking the 2/8 one. However, as long as the instrument is trading below the 2/8 level, the main scenario will suggest further decline towards the -1/8 one.
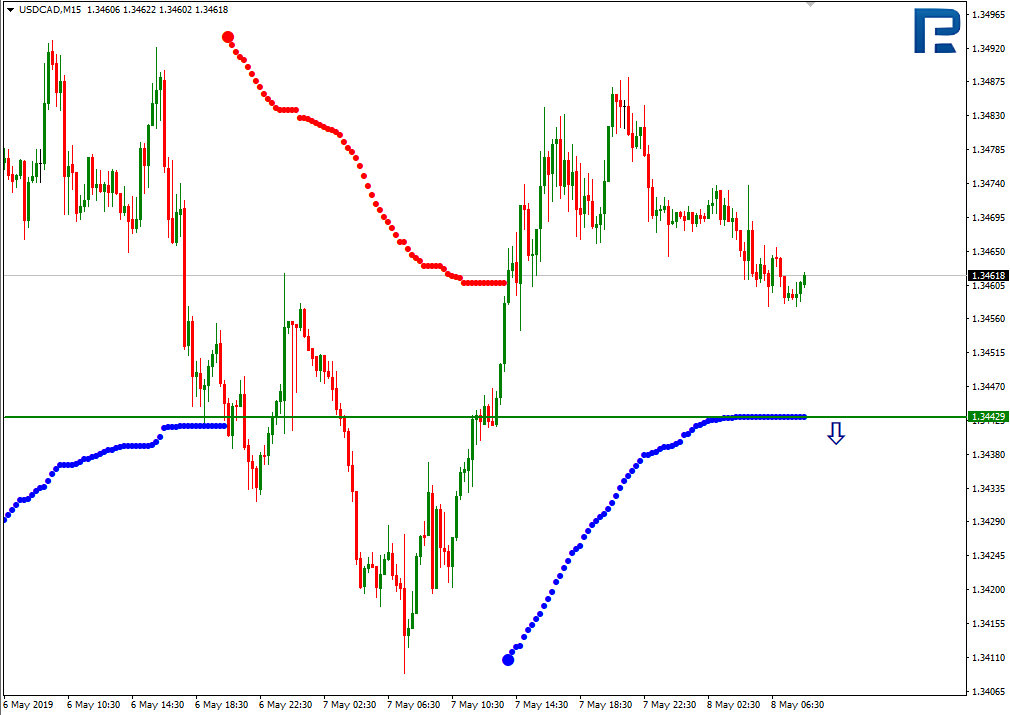
In the M15 chart, the pair may break the downside line of the VoltyChannel indicator and, as a result, continue trading downwards.
Forecasts presented in this section only reflect the author’s private opinion and should not be considered as guidance for trading. RoboForex bears no responsibility for trading results based on trading recommendations described in these analytical reviews.