Murrey Math Lines 13.05.2019 (EURUSD, GBPUSD)
EURUSD, “Euro vs. US Dollar”
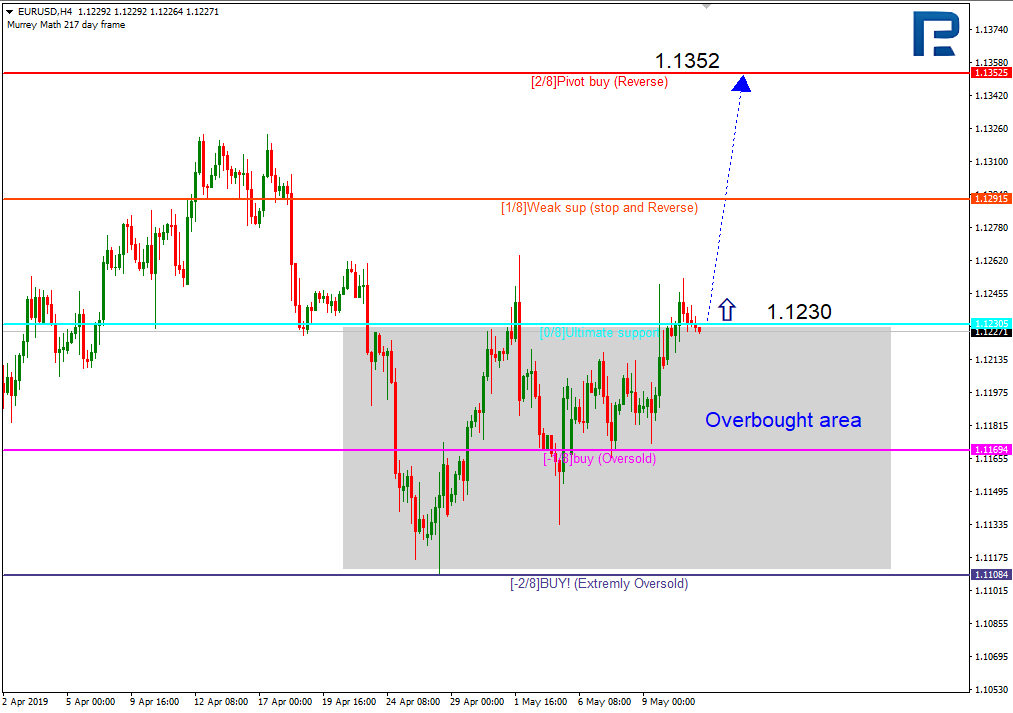
As we can see in the H4 chart, EURUSD is trying to leave the “oversold zone” for the third time, which may indicate a possible tendency to the upside. If the price fixes above the 0/8 level, the pair may continue rising to reach the resistance at the 2/8 one. However, this scenario may be cancelled if the instrument breaks the -1/8 level. In this case, one should wait until the lines in the chart are redrawn to define further downside targets.

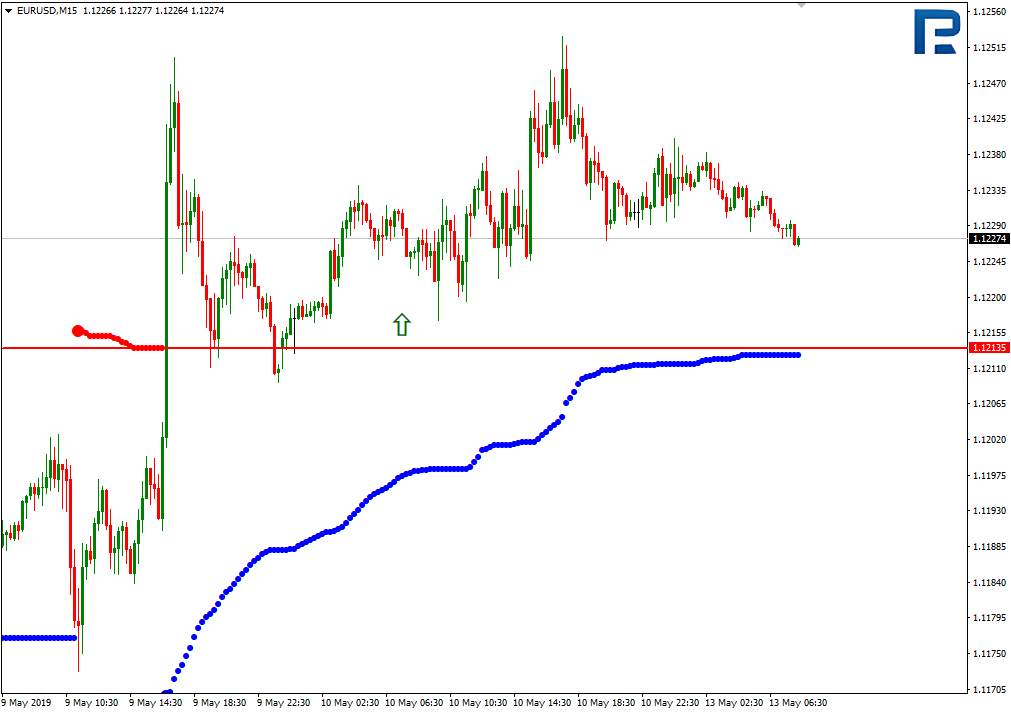
As we can see in the M15 chart, the pair has broken the upside line of the VoltyChannel indicator and, as a result, may continue trading upwards.
GBPUSD, “Great Britain Pound vs US Dollar”
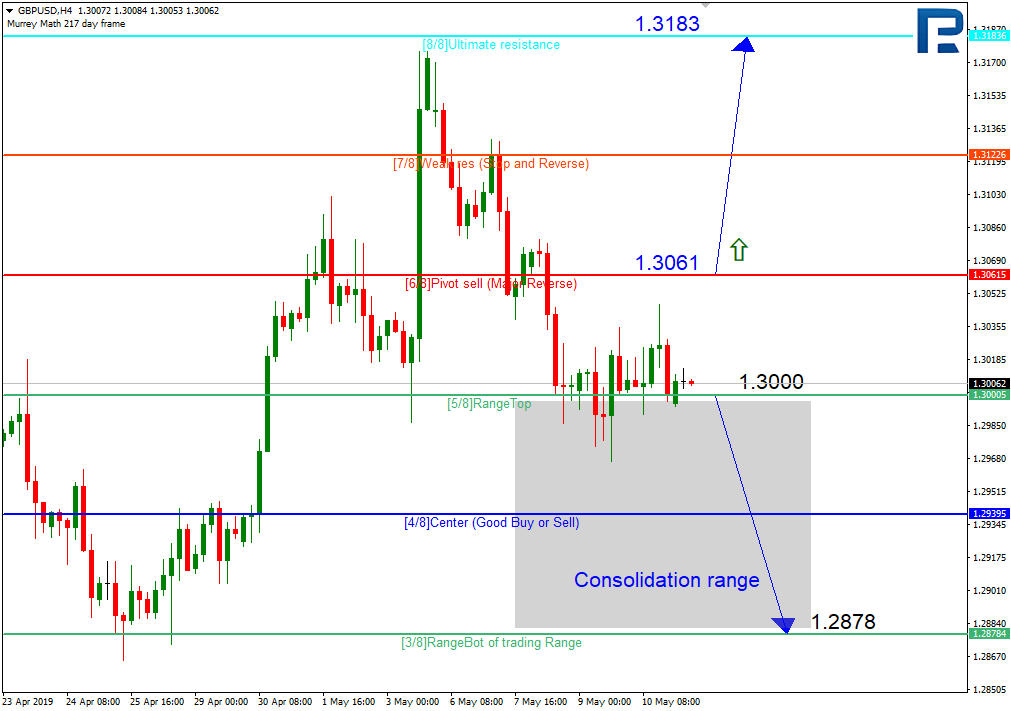
In the H4 chart, GBPUSD is still consolidating close to the 5/8 level. Currently, traders are increasing their positions. The current consolidation means that the market cant’ decide on further movements. In this case, the price may break the 6/8 level and continue growing towards the resistance at the 8/8 one. However, this scenario may be canceled if the instrument fixes below the 6/8 level. In this case, the pair may continue trading downwards and return to the support at the 3/8 one.
As we can see in the H1 chart, the pair is trading below the 3/8 level. In this case, the instrument may continue moving downwards to reach the first target at the 0/8 level.
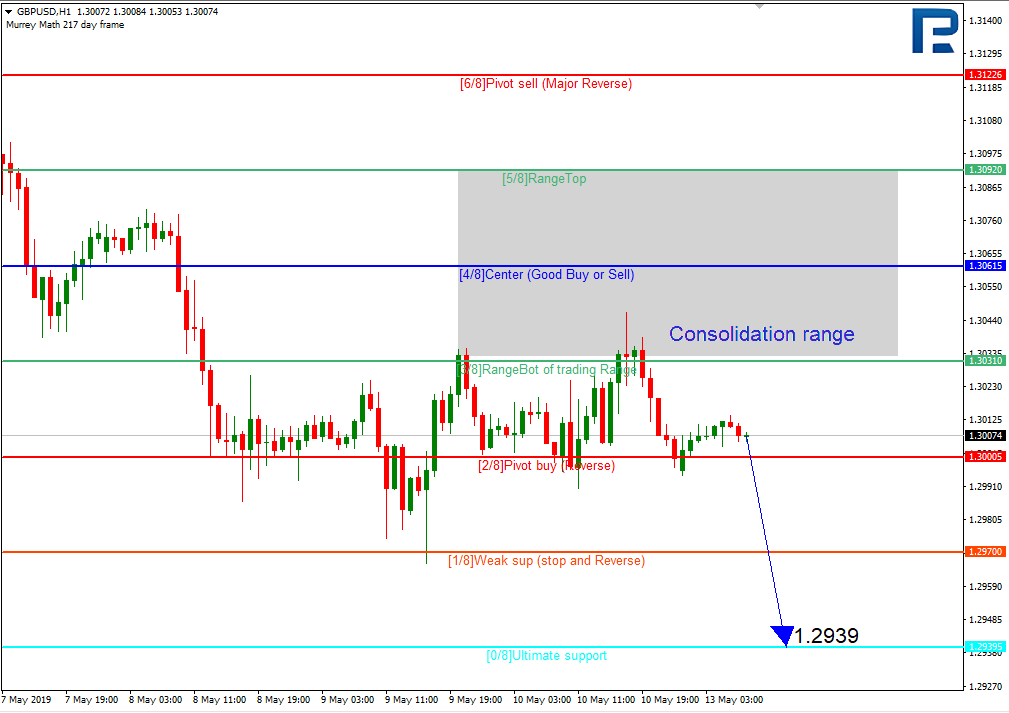
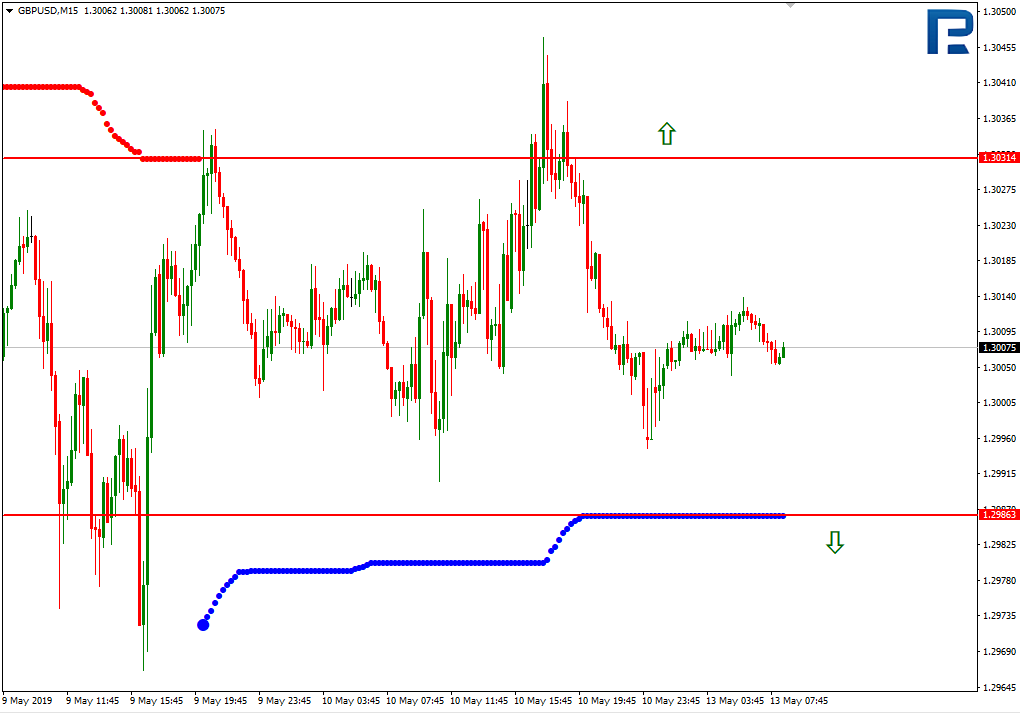
In the M15 chart, the pair is moving between the lines of the VoltyChannel indicator and, as a result, may continue trading sideways.
Forecasts presented in this section only reflect the author’s private opinion and should not be considered as guidance for trading. RoboForex bears no responsibility for trading results based on trading recommendations described in these analytical reviews.