Murrey Math Lines 03.05.2019 (EURUSD, GBPUSD)
EURUSD, “Euro vs. US Dollar”
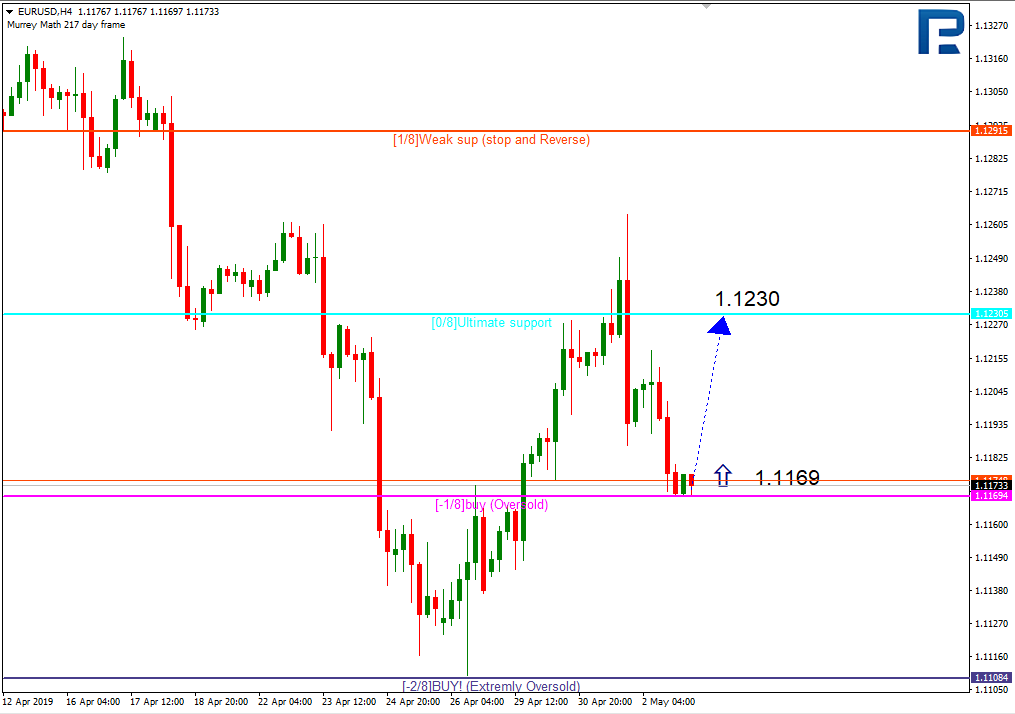
As we can see in the H4 chart, EURUSD is still trading inside the “oversold zone”. In this case, the price may rebound from the -1/8 level and resume its growth to reach the resistance at the 0/8 one.

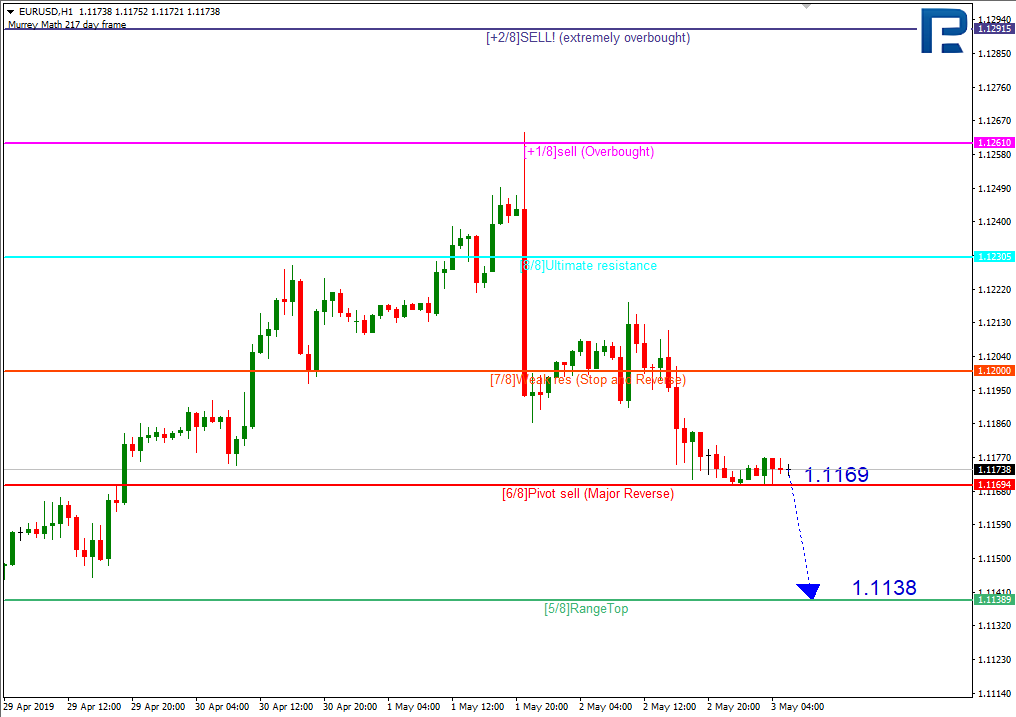
However, in the H1 chart the scenario may be a bit different. Earlier, the pair left the “overbought zone” and started falling towards the first target at the 5/8 level, but faced the resistance at the 6/8 one. If the price breaks the latter level, it may continue moving downwards to reach the 5/8 one.
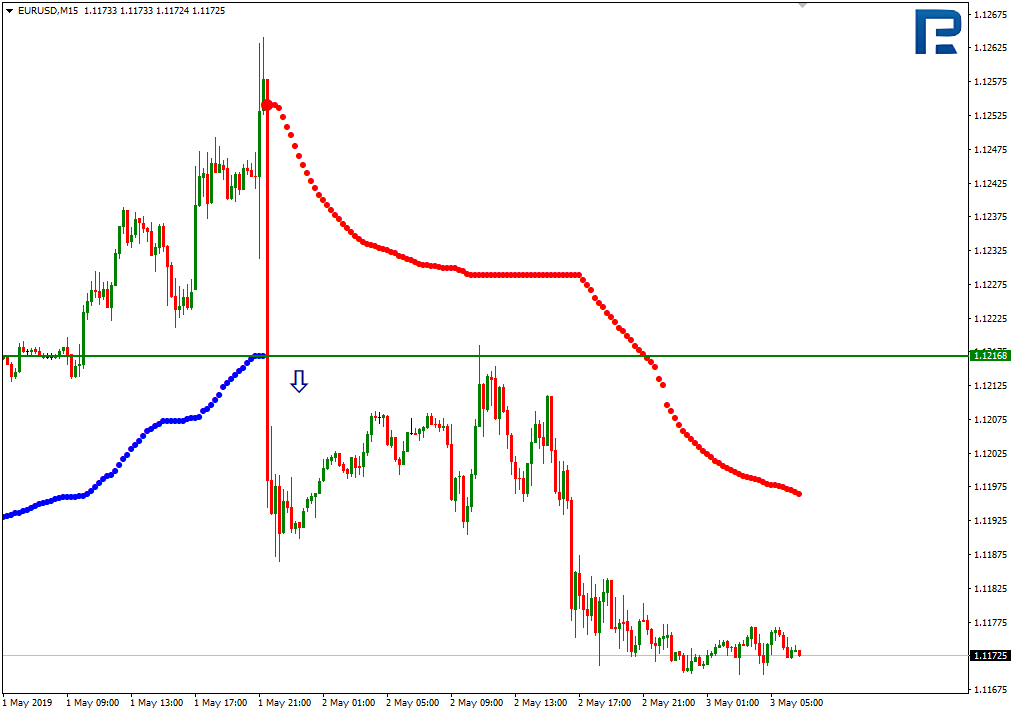
As we can see in the M15 chart, the pair has broken the downside line of the VoltyChannel indicator and, as a result, may continue trading downwards.
GBPUSD, “Great Britain Pound vs US Dollar”
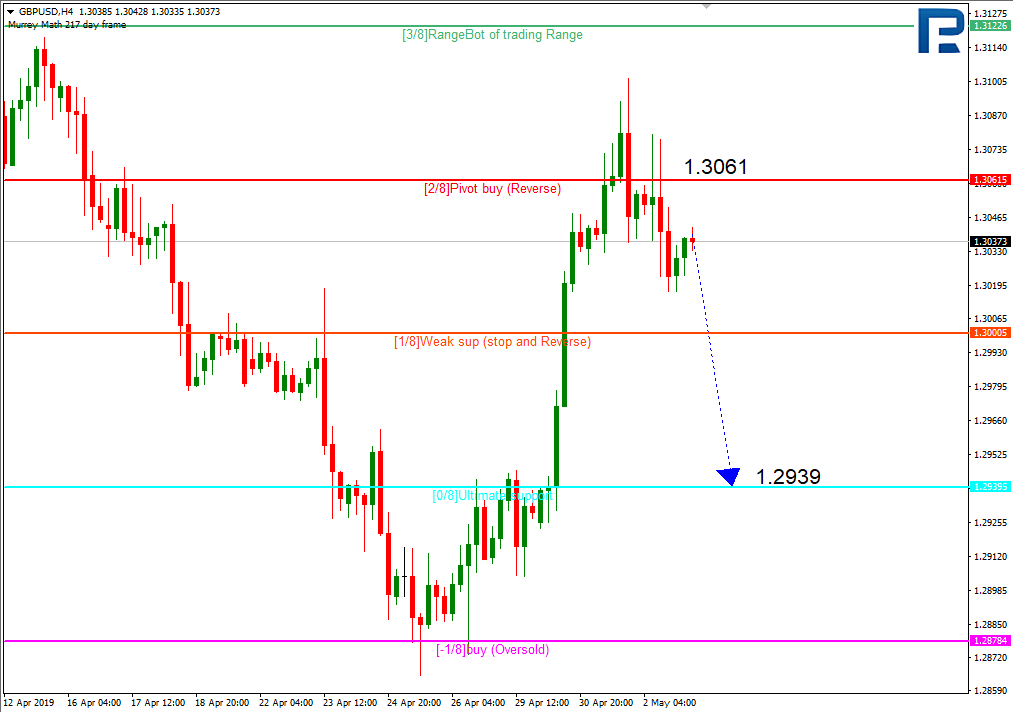
In the H4 chart, GBPUSD failed to break the resistance at the 2/8 level yesterday. In this case, the price is expected to resume trading downwards and reach the support at the 0/8 level.
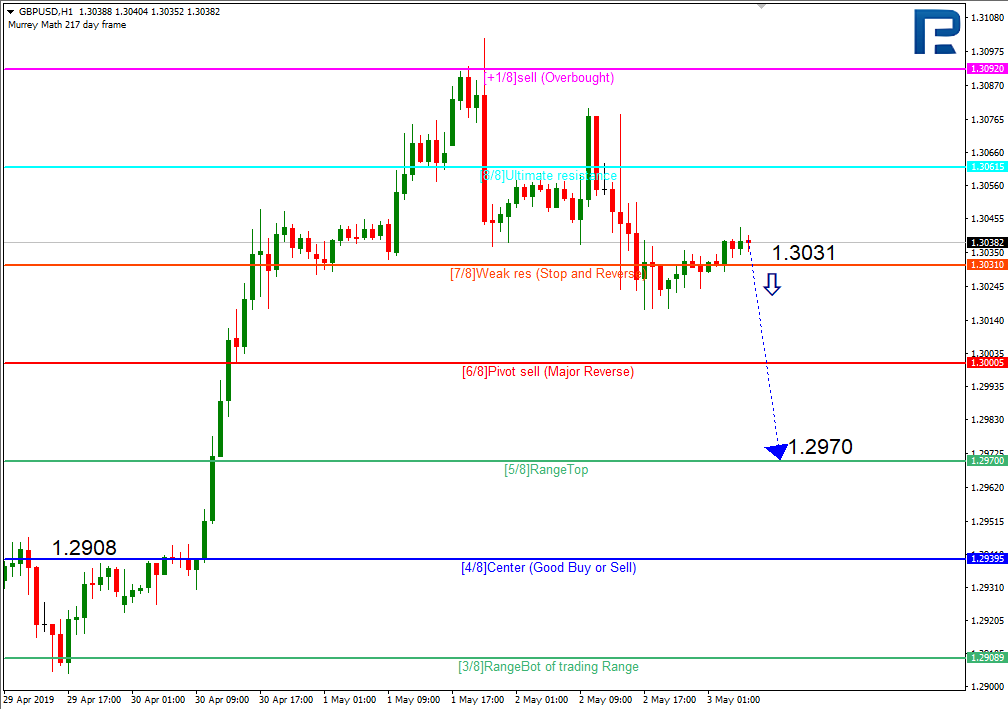
As we can see in the H1 chart, the pair is no longer trading inside the “overbought zone” and may continue moving downwards to reach the support at the 5/8 level.
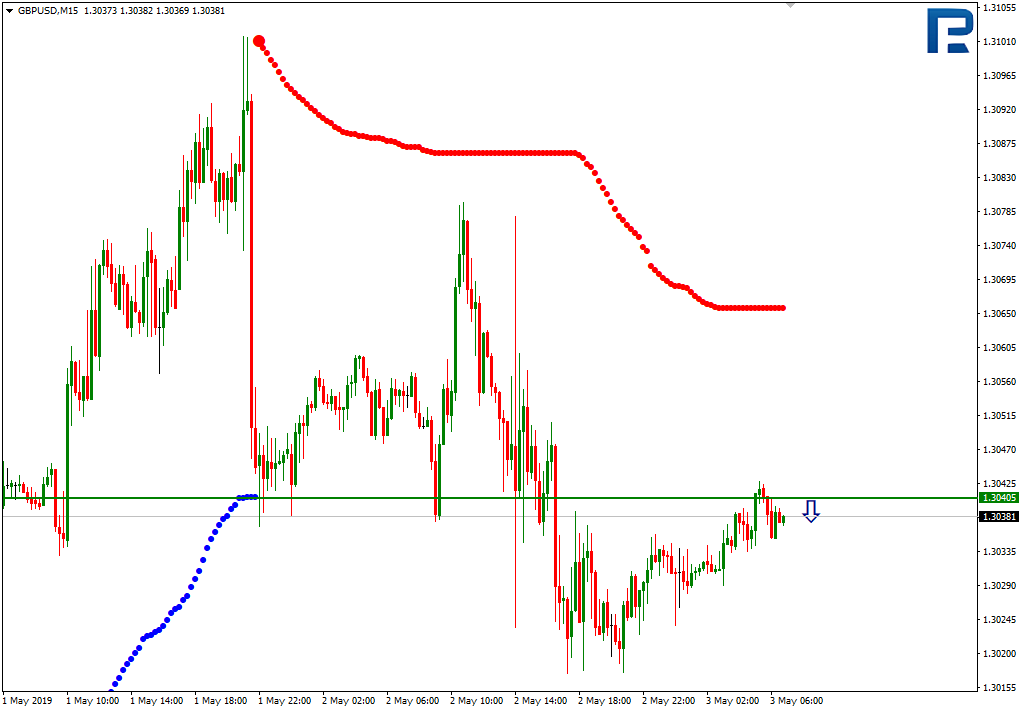
As we can see in the M15 chart, the pair has broken the downside line of the VoltyChannel indicator and, as a result, may continue trading downwards.
Forecasts presented in this section only reflect the author’s private opinion and should not be considered as guidance for trading. RoboForex bears no responsibility for trading results based on trading recommendations described in these analytical reviews.