Japanese Candlesticks Analysis 23.12.2013 (EUR/USD, USD/JPY)
23.12.2013
Analysis for December 23rd, 2013
EUR/USD
H4 chart of EUR/USD shows ascending movement, which is indicated by Tweezers pattern near support from Three Black Crows 04.10.13. Three Line Break chart and Heiken Ashi candlesticks confirm bullish tendency.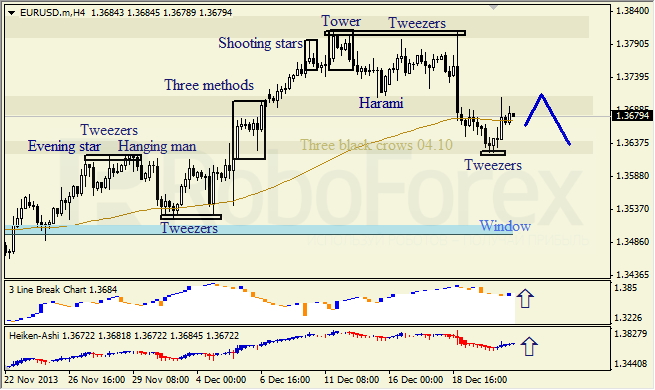
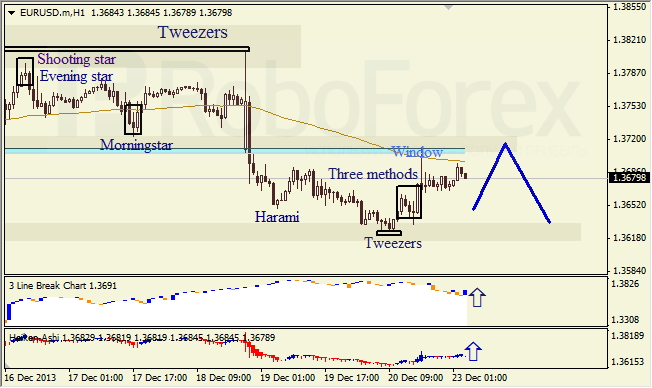
H1 chart of EUR/USD shows ascending movement, which is indicated by Three Methods pattern, Three Line Break chart, and Heiken Ashi candlesticks. Closest Window is resistance level.
USD/JPY
H4 chart of USD/JPY shows correction within ascending trend. Three Line Break chart and Heiken Ashi candlesticks confirm descending movement.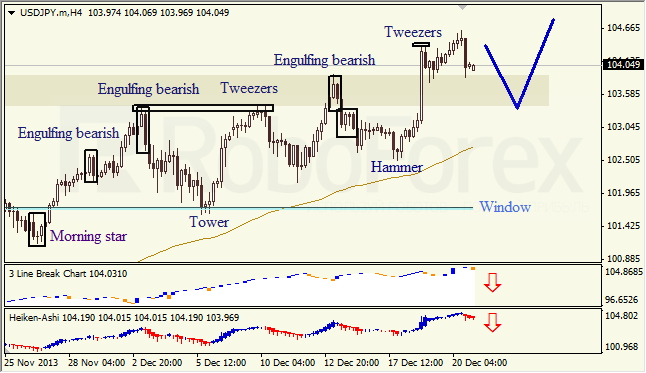
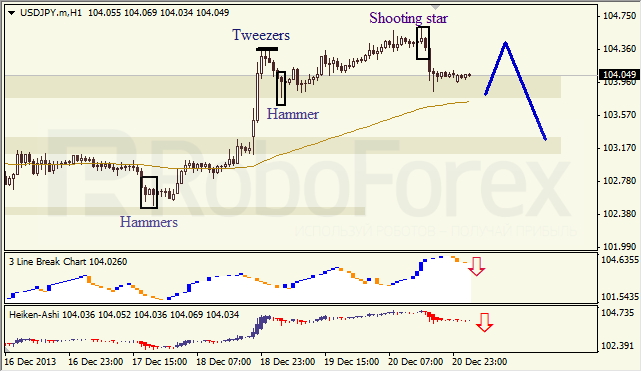
H1 chart of USD/JPY shows correction, which started after Shooting Star pattern. Three Line Break chart and Heiken Ashi candlesticks confirm descending movement.
RoboForex Analytical Department
Attention!
Forecasts presented in this section only reflect the author’s private opinion and should not be considered as guidance for trading. RoboForex bears no responsibility for trading results based on trading recommendations described in these analytical reviews.