Japanese Candlesticks Analysis 08.04.2014 (EUR/USD, USD/JPY)
08.04.2014
Analysis for April 8th, 2014
EUR USD, “Euro vs US Dollar”
H4 chart of EUR USD shows ascending movement, which is indicated by Hammers pattern near daily Window. Three Line Break chart and Heiken Ashi candlesticks confirm bullish correction.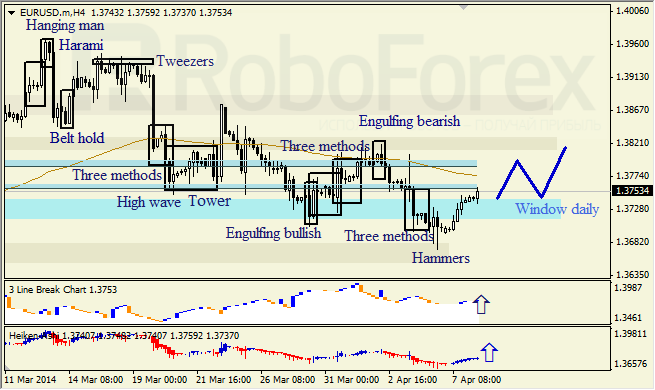
H1 chart of EUR USD shows bullish tendency, which is indicated by Long Legged Doji pattern. Price completed sideways correction below upper Window. Three Line Break chart and Heiken Ashi candlesticks confirm ascending movement.

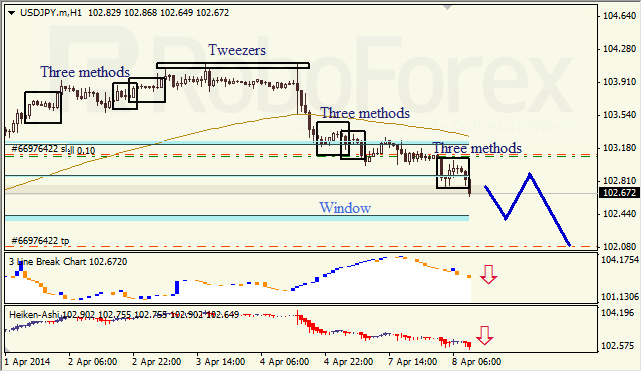
USD JPY, “US Dollar vs Japanese Yen”
H4 chart of USD JPY shows bearish tendency, which is indicated by Three Methods pattern. Three Line Break chart and Heiken Ashi candlesticks confirm current tendency.
H1 chart of USD JPY also shows bearish tendency. Three Methods pattern, Three Line Break chart, and Heiken Ashi candlesticks confirm descending movement.
RoboForex Analytical Department
Attention!
Forecasts presented in this section only reflect the author’s private opinion and should not be considered as guidance for trading. RoboForex bears no responsibility for trading results based on trading recommendations described in these analytical reviews.