Japanese Candlesticks Analysis 13.03.2014 (EUR/USD, USD/JPY)
13.03.2014
Analysis for March 13th, 2014
EUR USD, “Euro vs US Dollar”
H4 chart of EUR USD shows bullish tendency within ascending trend. Three Methods pattern, Three Line Break chart, and Heiken Ashi candlesticks confirm that current trend continues.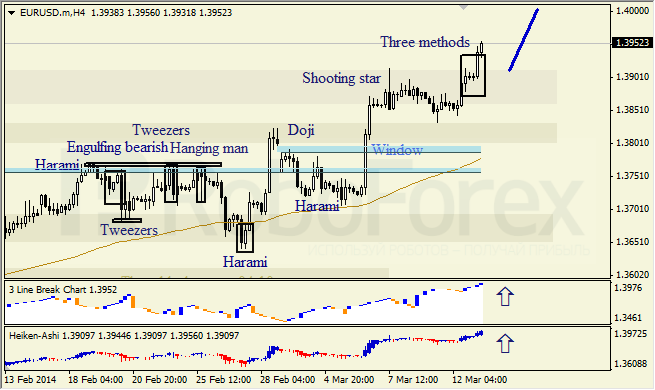
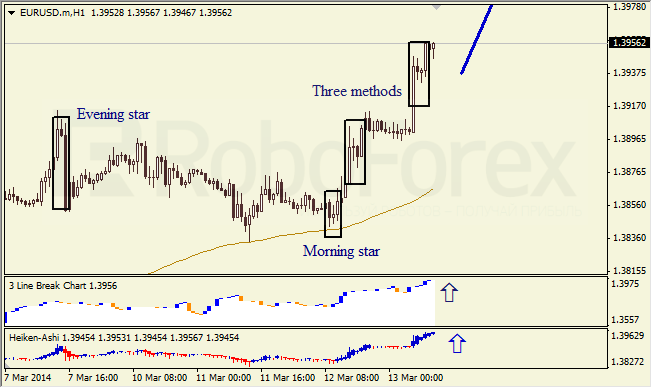
H1 chart of EUR USD also shows bullish tendency within ascending trend. Three Methods pattern, Three Line Break chart, and Heiken Ashi candlesticks confirm current trend.
USD JPY, “US Dollar vs Japanese Yen”
H4 chart of USD JPY shows bearish tendency, which is indicated by Harami pattern. Three Line Break chart and Heiken Ashi candlesticks confirm descending movement.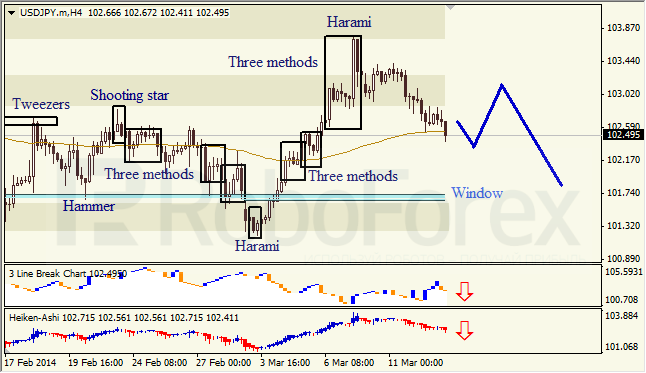
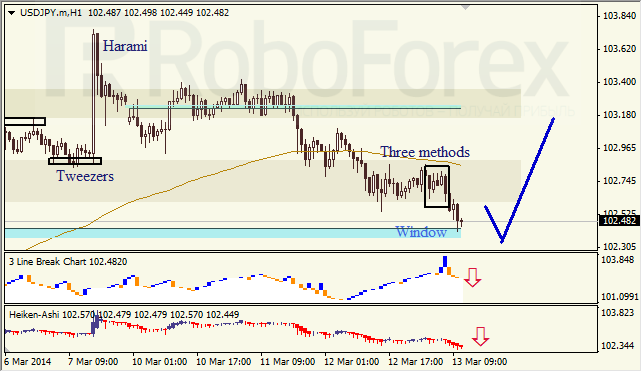
H1 chart of USD JPY also shows bearish tendency, which is indicated by Three Methods pattern. Closest Window is support level. Three Line Break chart and Heiken Ashi candlesticks indicate that bearish tendency continues.
RoboForex Analytical Department
Attention!
Forecasts presented in this section only reflect the author’s private opinion and should not be considered as guidance for trading. RoboForex bears no responsibility for trading results based on trading recommendations described in these analytical reviews.