Fibonacci Retracements Analysis 31.01.2019 (AUDUSD, USDCAD)
AUDUSD, “Australian Dollar vs US Dollar”
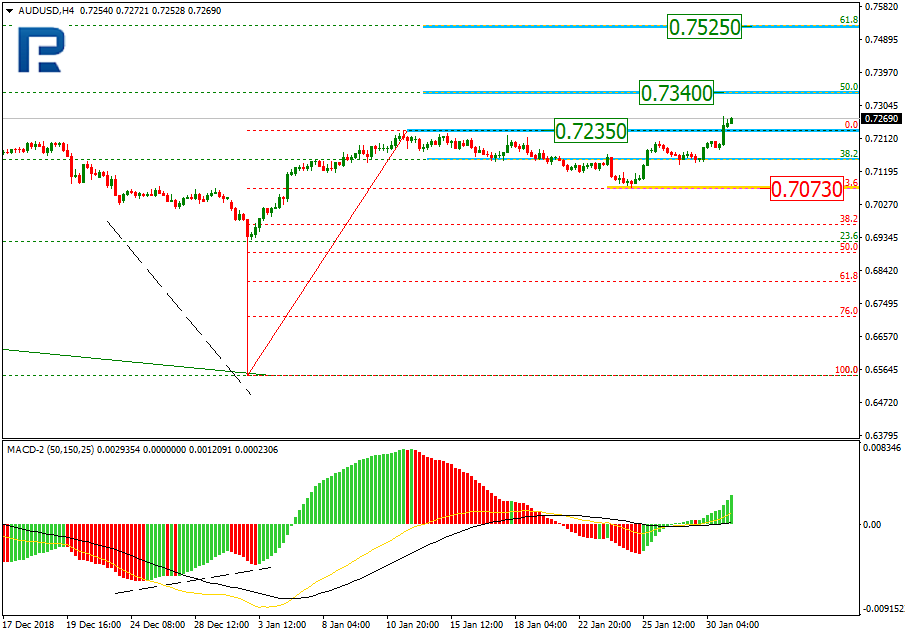
As we can see in the H4 chart, AUDUSD is forming a new rising wave. After being corrected to the downside by 23.6% (0.7073), the pair has finished another ascending impulse. If the price breaks the high at 0.7235, the instrument may continue growing to reach the mid-term retracements of 50.0% and 61.8% at 0.7340 and 0.7525 respectively. The support level is at 0.7073.

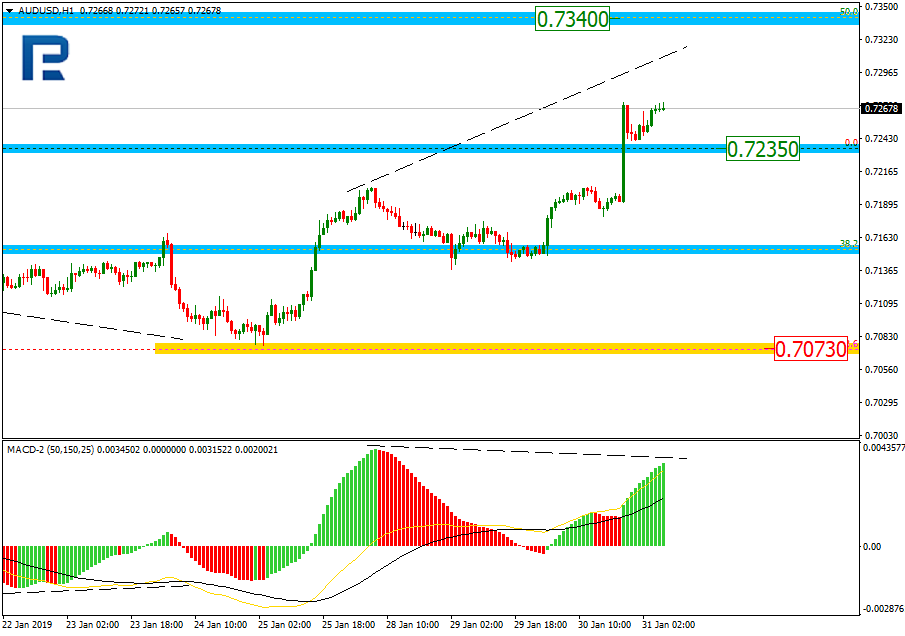
In the H1 chart, AUDUSD is steadily trading upwards. At the same time, there is a divergence on MACD, which indicates a possible pullback towards 0.7235 after the instrument reaches the retracement of 50.0% at 0.7340.
USDCAD, “US Dollar vs Canadian Dollar”
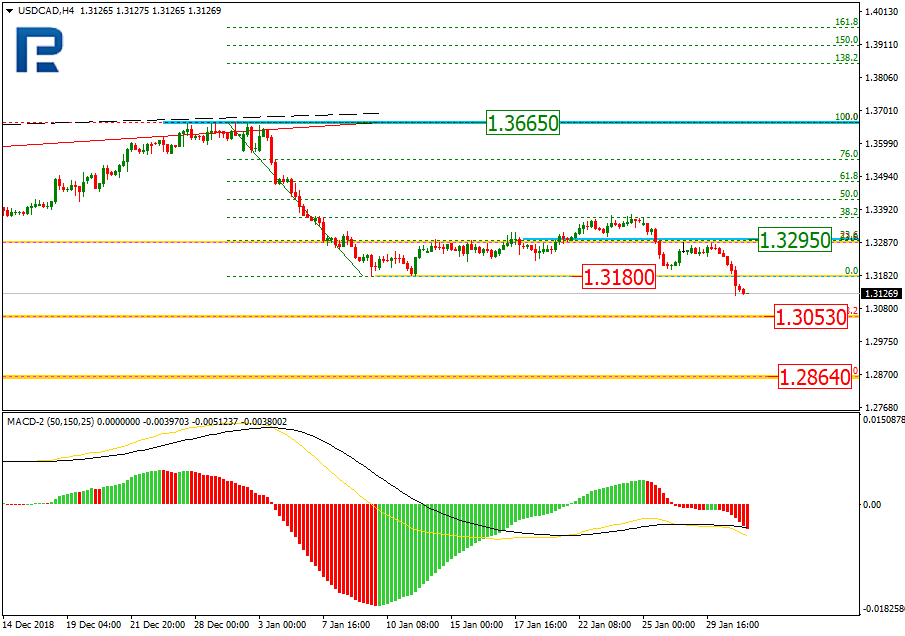
As we can see in the H4 chart, after breaking the low, USDCAD is forming a new descending wave. The possible downside targets may be the retracements of 38.2% and 50.0% at 1.3053 and 1.2864 respectively. The resistance level is at 1.3295.
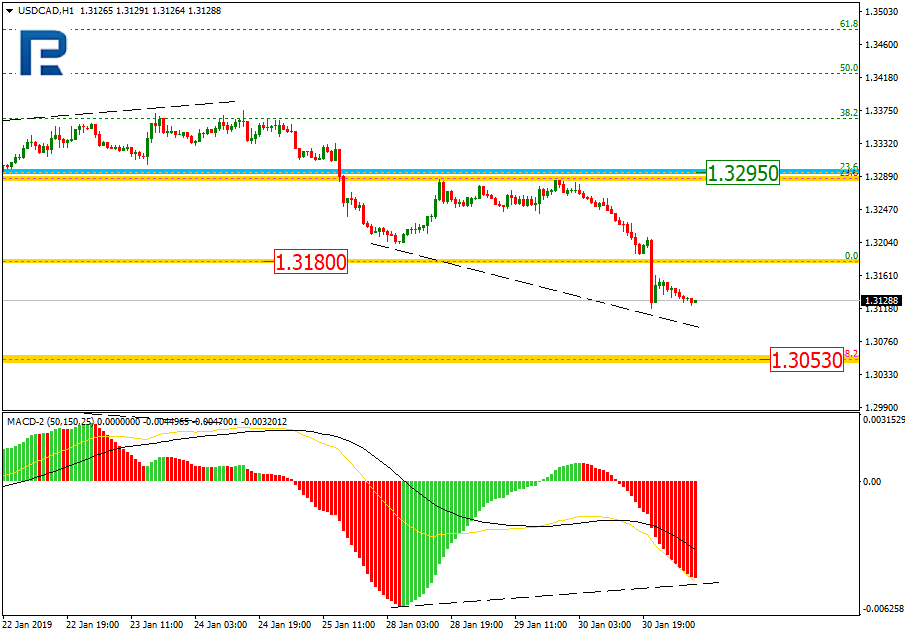
In the H1 chart, the price is trading downwards to reach the retracement of 38.2% at 1.3053. At the same time, there is a convergence on MACD, which indicates a possible reverse and a pullback in the future.
Forecasts presented in this section only reflect the author’s private opinion and should not be considered as guidance for trading. RoboForex bears no responsibility for trading results based on trading recommendations described in these analytical reviews.