Fibonacci Retracements Analysis 30.08.2018 (AUDUSD, USDCAD)
AUDUSD, “Australian Dollar vs US Dollar”
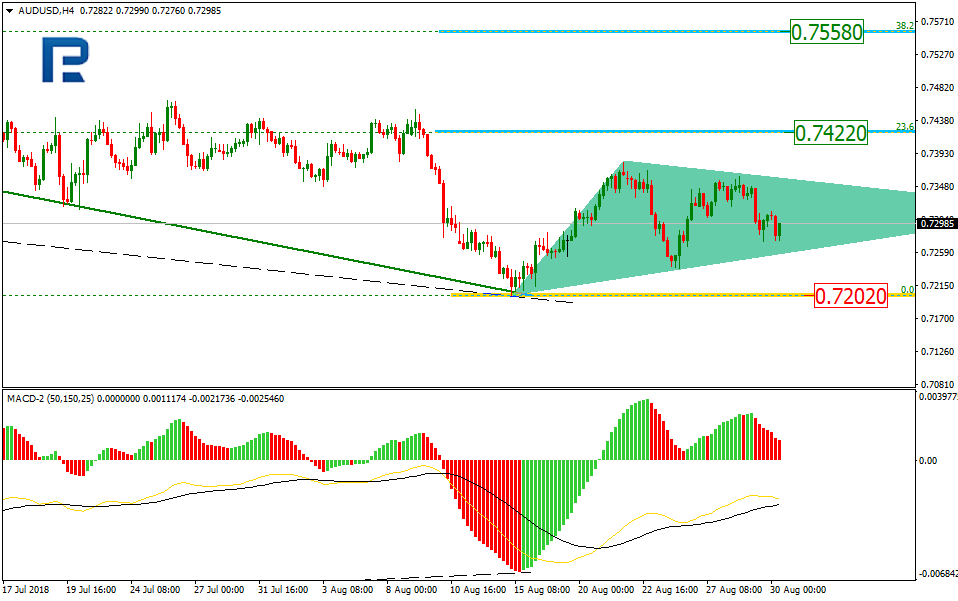
As we can see in the H4 chart, AUDUSD is being corrected in the form of the Triangle pattern. If the pair breaks the pattern’s upside border, the uptrend may continue towards the retracements of 23.6% and 38.2% at 0.7422 and 0.7558 respectively. However, in case the price breaks the low at 0.7202, the instrument may continue falling to reach 0.7140.

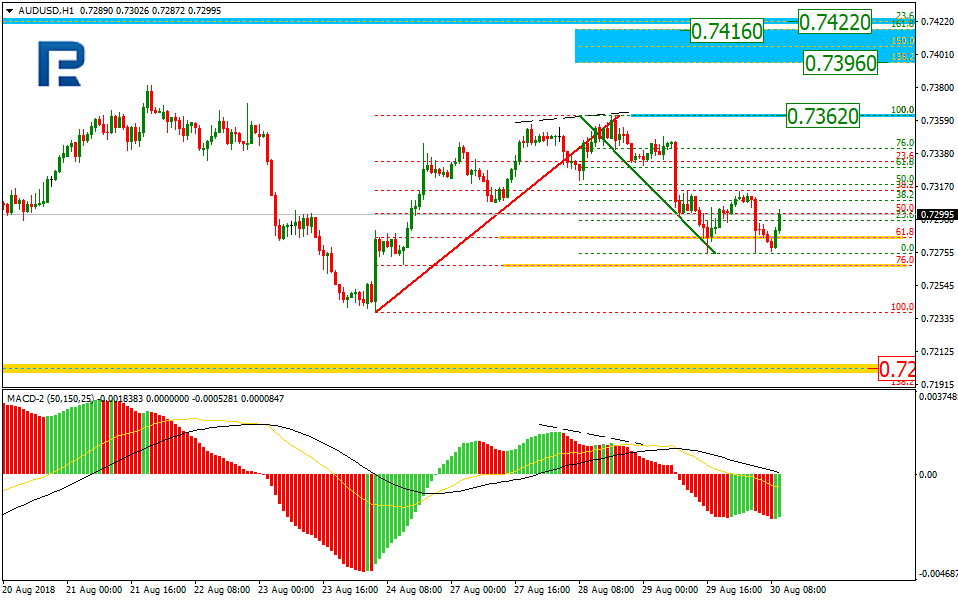
In the H1 chart, the pair is starting a new ascending impulse. The target is the local high at 0.7362. After breaking it, the instrument may continue growing towards the post-correctional extension area between the retracements of 138.2% and 161.8% at 0.7396 and 0.7416 respectively.
USDCAD, “US Dollar vs Canadian Dollar”
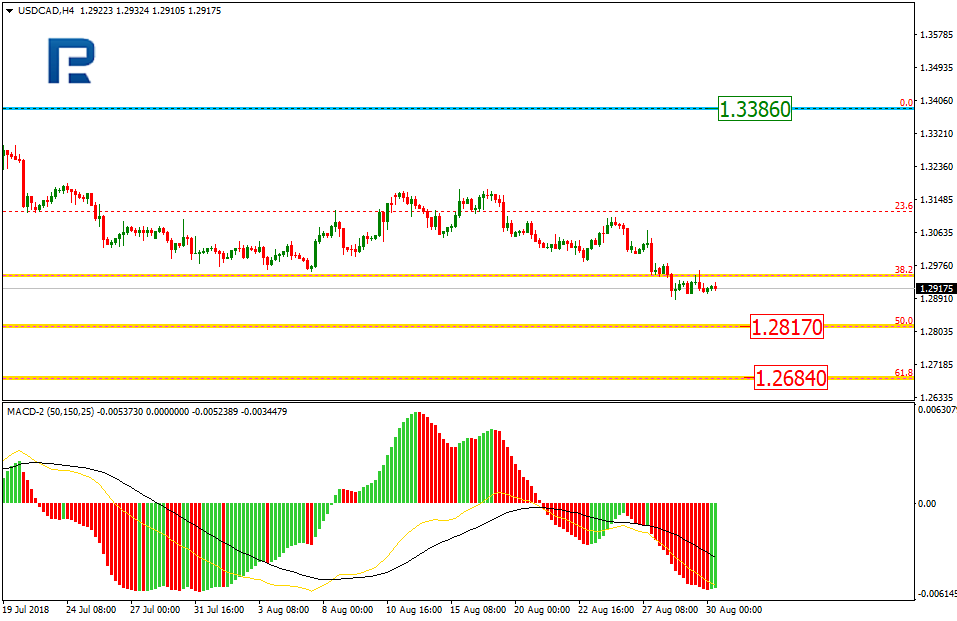
As we can see in the H4 chart, USDCAD is being corrected to the downside towards the retracement of 50.0% at 1.2817. The next possible target is the retracement of 61.8% at 1.2684. The resistance level is the high at 1.3386.
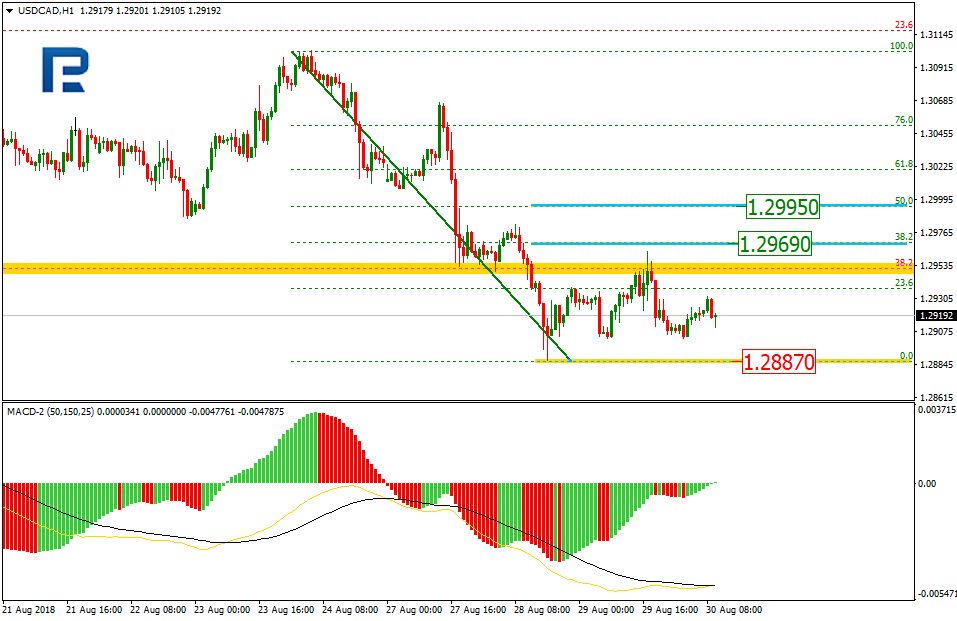
In the H1 chart, the pair completed the descending impulse and then started a new pullback, which is heading towards the retracements of 38.2% and 50.0% at 1.2969 and 1.2995 respectively. The support level is the low at 1.2887.
Forecasts presented in this section only reflect the author’s private opinion and should not be considered as guidance for trading. RoboForex bears no responsibility for trading results based on trading recommendations described in these analytical reviews.