Fibonacci Retracements Analysis 29.11.2018 (AUDUSD, USDCAD)
AUDUSD, “Australian Dollar vs US Dollar”
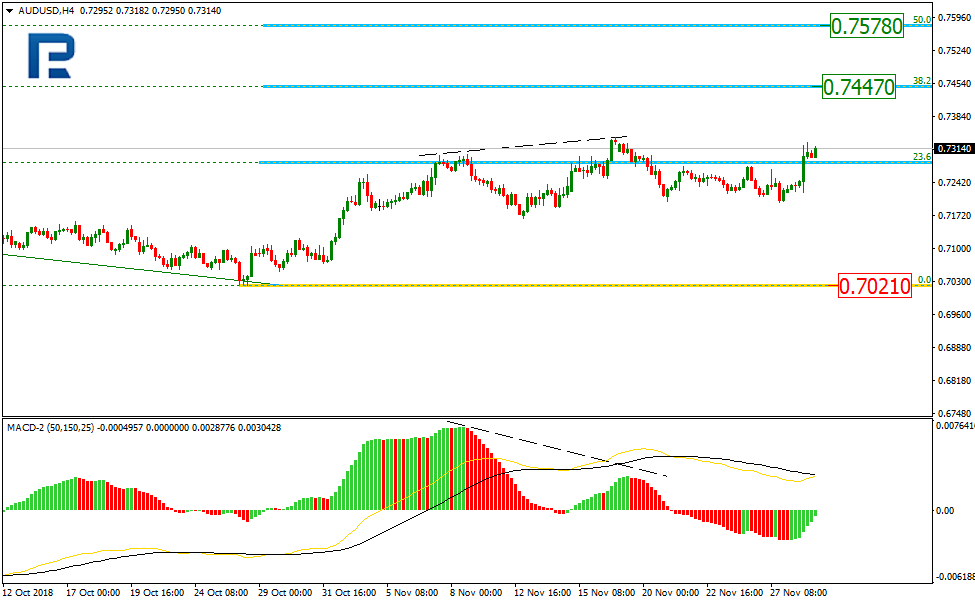
As we can see in the H4 chart, after finishing the correction, AUDUSD started a new rising impulse. After breaking the high, the instrument may continue the mid-term correctional uptrend towards the retracements of 38.2% and 50.0% at 0.7447 and 0.7578 respectively. The support is the low at 0.7021.

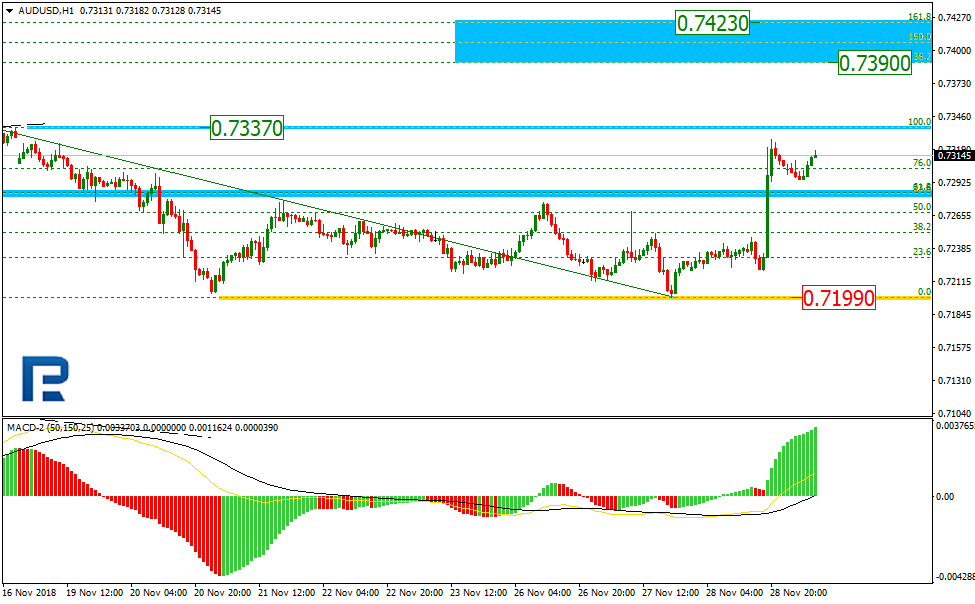
In the H1 chart, the pair is trading towards the high at 0.7337. If later the price break it, the instrument may continue growing towards the post-correctional extension area between the retracements of 138.2% and 161.8% at 0.7390 and 0.7423 respectively.
USDCAD, “US Dollar vs Canadian Dollar”
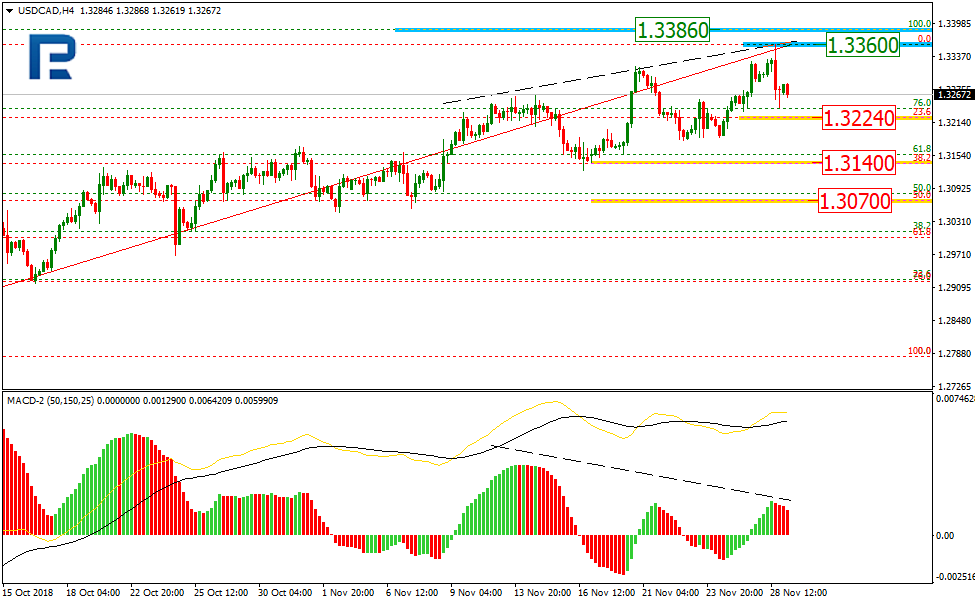
As we can see in the H4 chart, USDCAD has got very close to the high at 1.3386. At the same time, there is a divergence on MACD, which may indicate a possible correction to the downside in the nearest future. The targets may be the retracements of 23.6%, 38.2%, and 50.0% at 1.3224, 1.3140, and 1.3070 respectively.
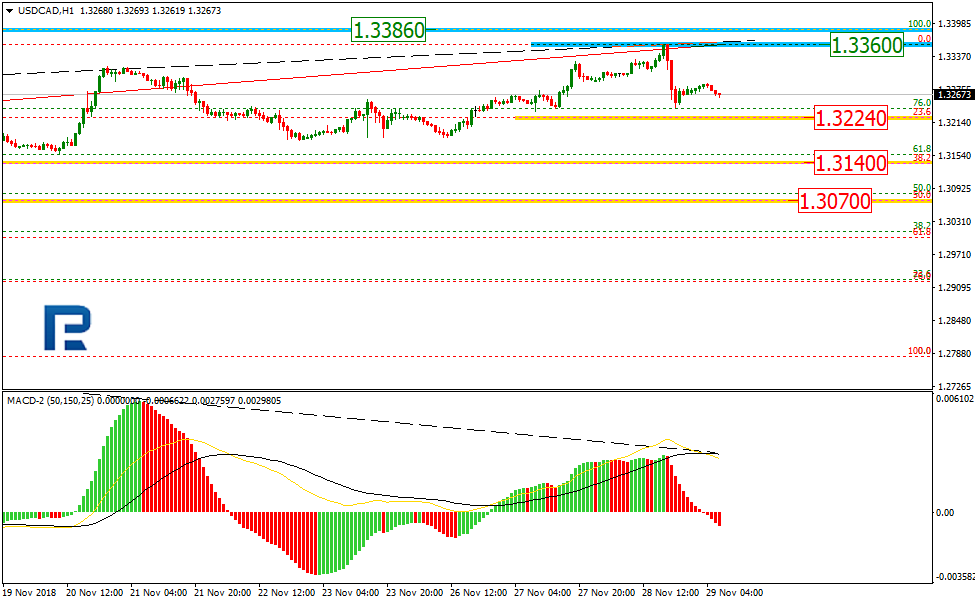
In the H1 chart, the price is trading towards the retracement of 23.6% at 1.3224. If the pair breaks the high at 1.3360, the instrument will continue moving upwards.
Forecasts presented in this section only reflect the author’s private opinion and should not be considered as guidance for trading. RoboForex bears no responsibility for trading results based on trading recommendations described in these analytical reviews.