Fibonacci Retracements Analysis 28.08.2018 (EURUSD, USDJPY)
EURUSD, “Euro vs US Dollar”
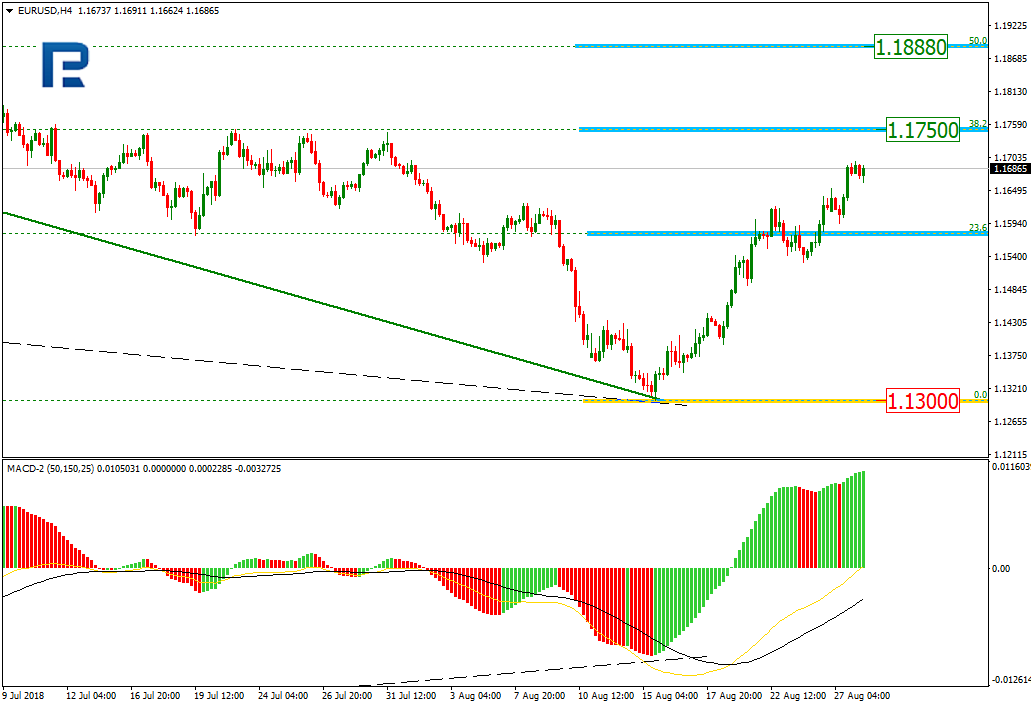
In the H4 chart, EURUSD is still being corrected to the upside towards the retracement of 38.2% at 1.1750. The next upside target may be the retracement of 50.0% at 1.1888. The support level is the low at 1.1300.

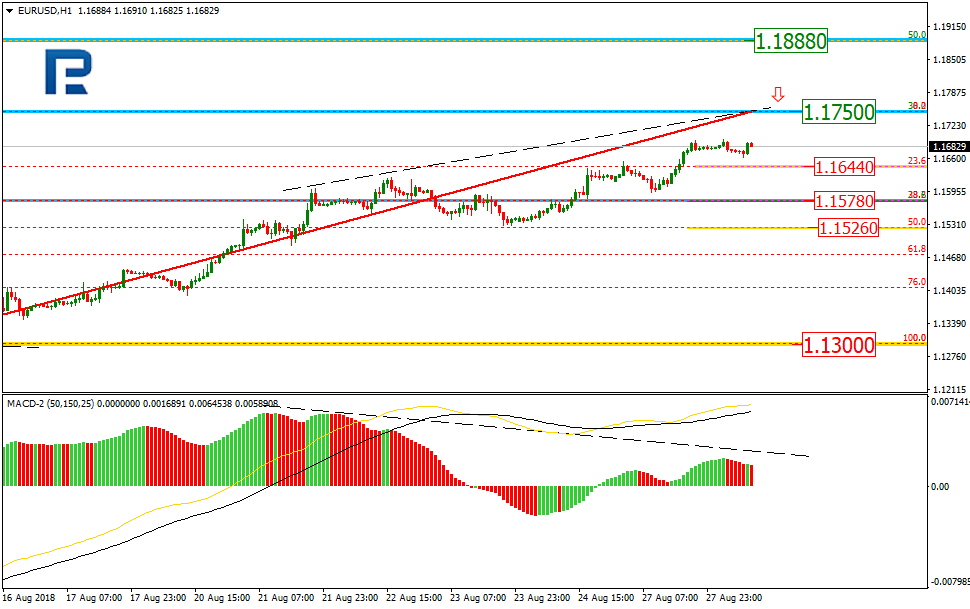
As we can see in the H1 chart, the divergence is being formed, which may indicate a new pullback after the price reaches the target at 1.1750. The targets of this pullback maybe the retracements of 23.6%, 38.2%, and 50.0% at 1.1644, 1.1578, and 1.1526 respectively.
USDJPY, “US Dollar vs. Japanese Yen”
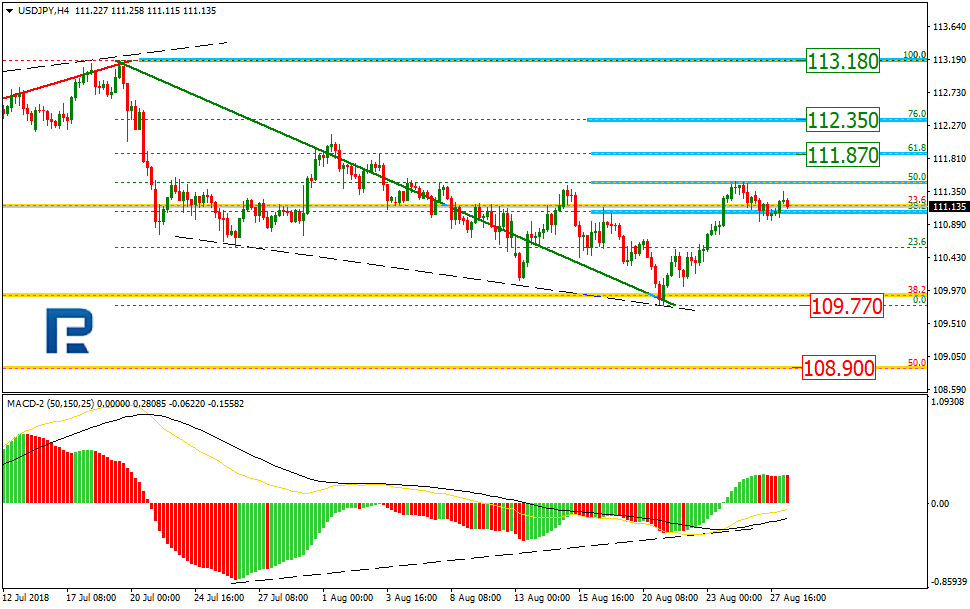
As we can see in the H4 chart, the convergence made USDJPY reverse and start a new correctional uptrend, which has already reached the retracement of 50.0% and may continue towards the retracements of 61.8% and 76.0% at 111.87 and 112.35 respectively. However, if the price breaks the low at 109.77, the mid-term correction may continue towards the retracement of 50.0% at 108.90.
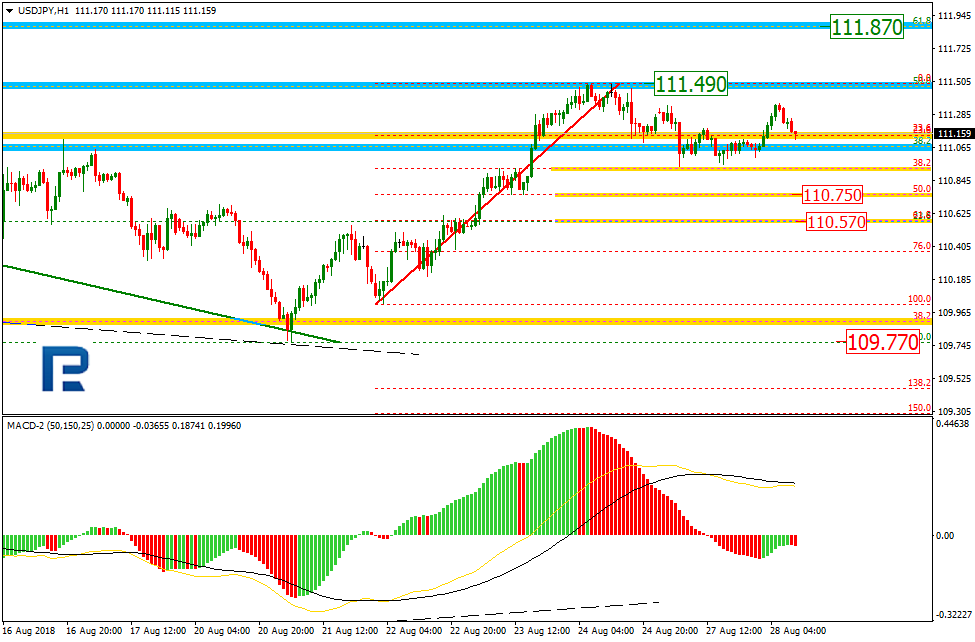
In the H1 chart, after finishing the ascending impulse, the pair started a new correction to the downside, which has already reached the retracement of 38.2%. The next targets may be the retracements of 50.0% and 61.8% at 110.75 and 110.57 respectively.
Forecasts presented in this section only reflect the author’s private opinion and should not be considered as guidance for trading. RoboForex bears no responsibility for trading results based on trading recommendations described in these analytical reviews.