Fibonacci Retracements Analysis 27.06.2019 (AUDUSD, USDCAD)
AUDUSD, “Australian Dollar vs US Dollar”
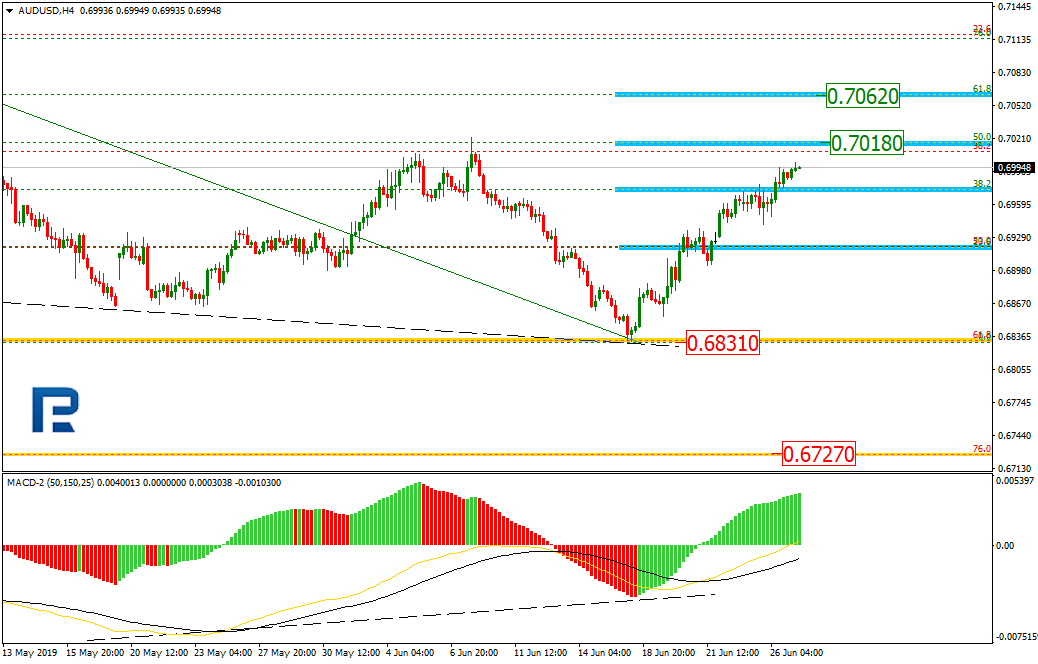
In the H4 chart, the correctional uptrend continues. AUDUSD is heading towards 50.0% and 61.8% fibo at 0.7018 and 0.7062 respectively. After finishing the correction, the price may resume falling to break the low at 0.6831 and then continue moving towards the mid-term target at 76.0% fibo at 0.6727.

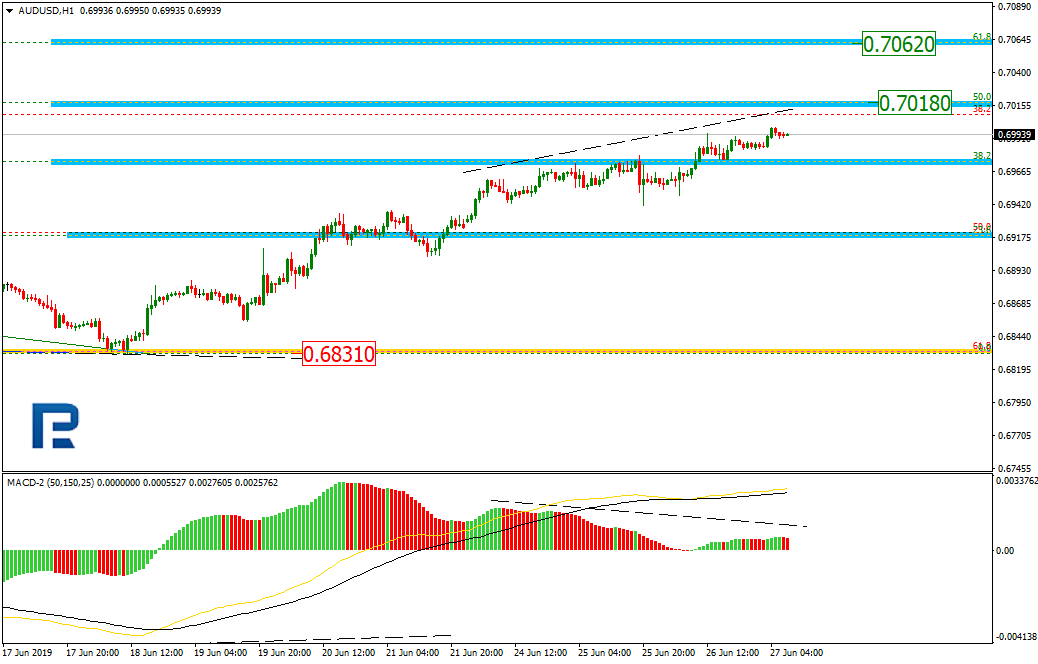
In the H1 chart, AUDUSD is growing towards 50.0% fibo at 0.7018. At the same time, there is a divergence on MACD, which may indicate a trend reverse quite soon.
USDCAD, “US Dollar vs Canadian Dollar”
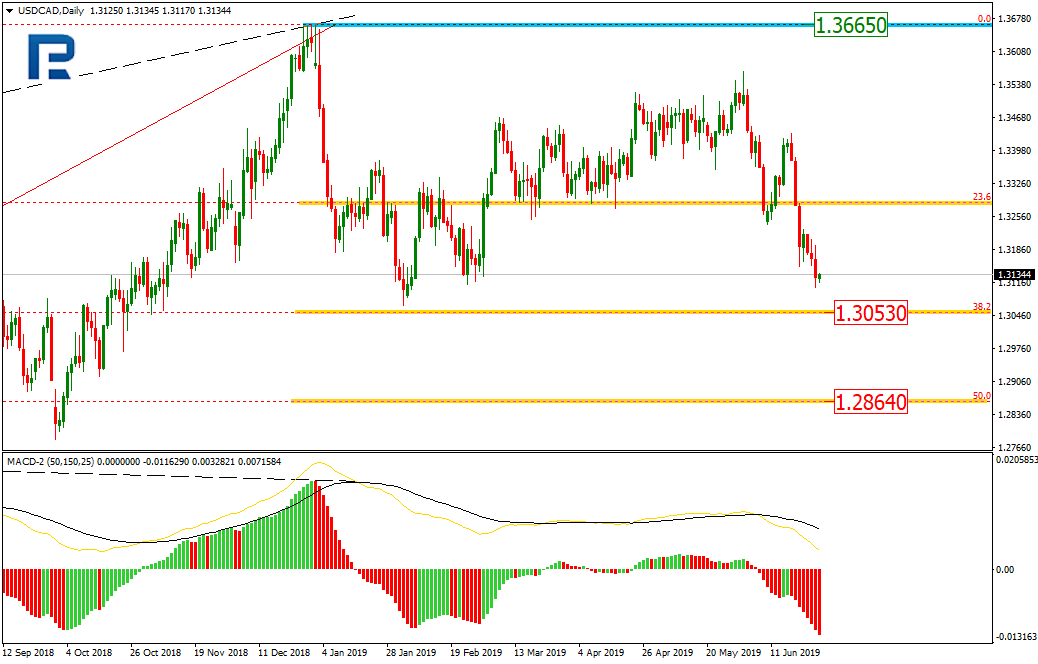
In case of USDCAD, it’s better to analyze the mid-term trading situation on the daily chart. As we can see, USDCAD is forming another descending wave; it has almost reached 38.2% fibo at 1.3053. The next target of the current decline may be 50.0% fibo at 1.2864. The key resistance is at 1.3665.
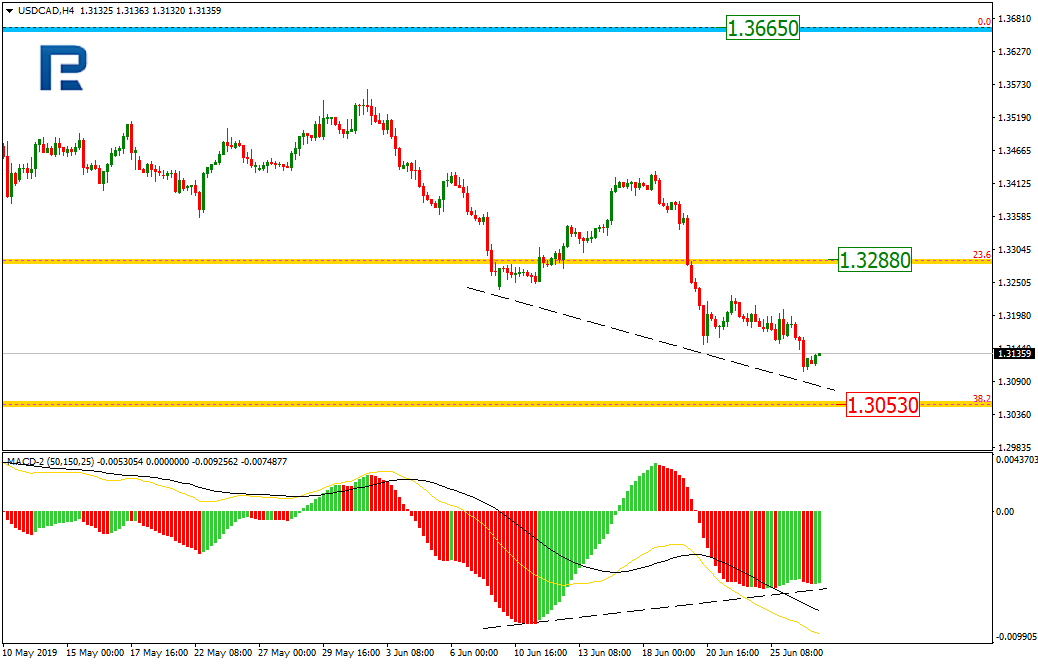
As we can see in the H4 chart, the pair is steadily trading downwards towards its long-term target at 38.2% fibo at 1.3053. At the same time, there is a convergence on MACD, which indicates a possible pullback soon with the target at 23.6% fibo at 1.3288.
Forecasts presented in this section only reflect the author’s private opinion and should not be considered as guidance for trading. RoboForex bears no responsibility for trading results based on trading recommendations described in these analytical reviews.