Fibonacci Retracements Analysis 25.10.2018 (AUDUSD, USDCAD)
AUDUSD, “Australian Dollar vs US Dollar”
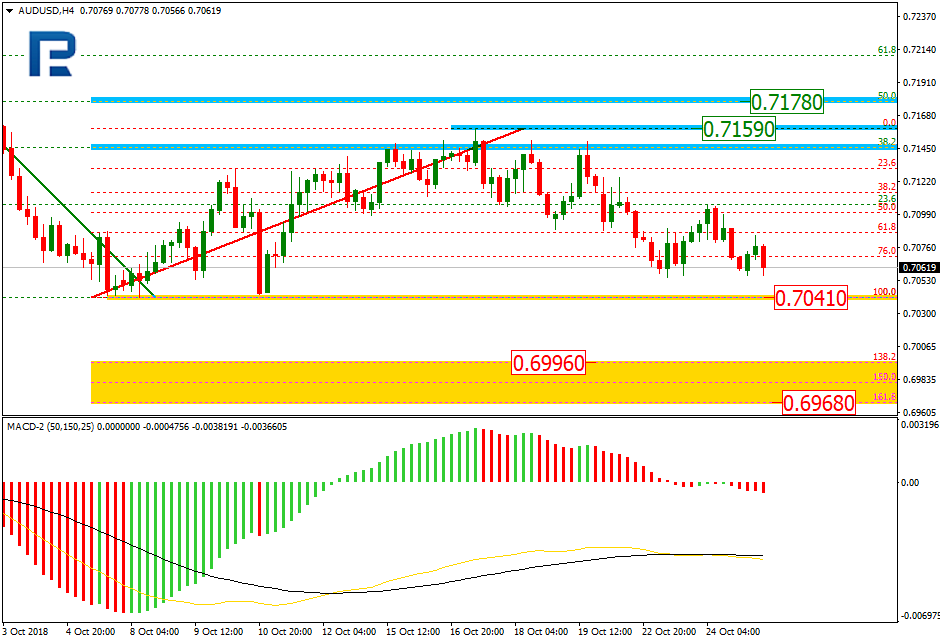
As we can see in the H4 chart, AUDUSD is about to complete the correction. The new downtrend is heading towards the support level at 0.7041. If the price breaks this level, the instrument may continue trading towards the post-correctional extension area between the retracements of 138.2% and 161.8% at 0.6996 and 0.6968 respectively. The key resistance level is at 0.7159.

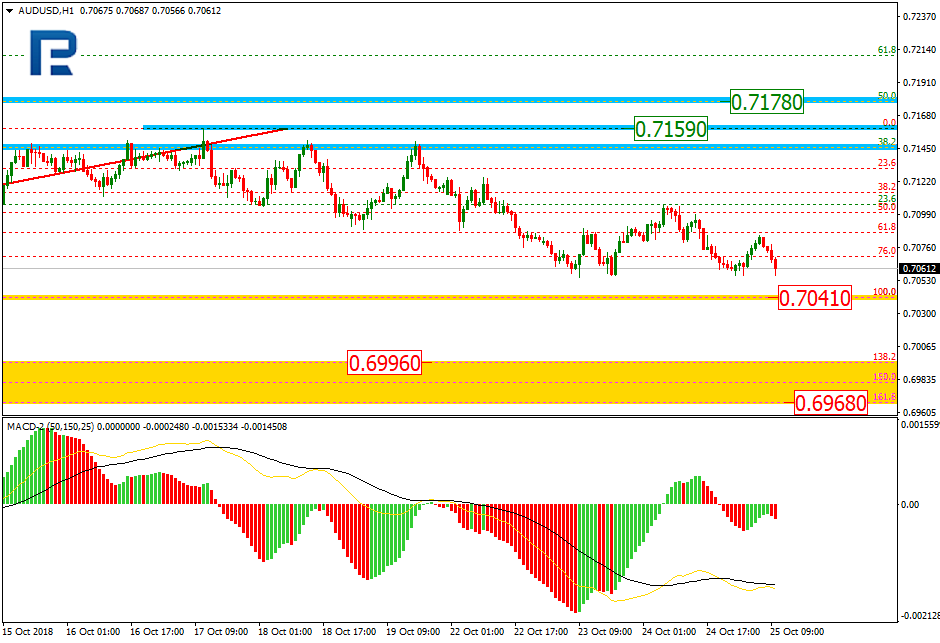
The H1 chart shows more detailed structure of the current descending movement towards 0.7041.
USDCAD, “US Dollar vs Canadian Dollar”
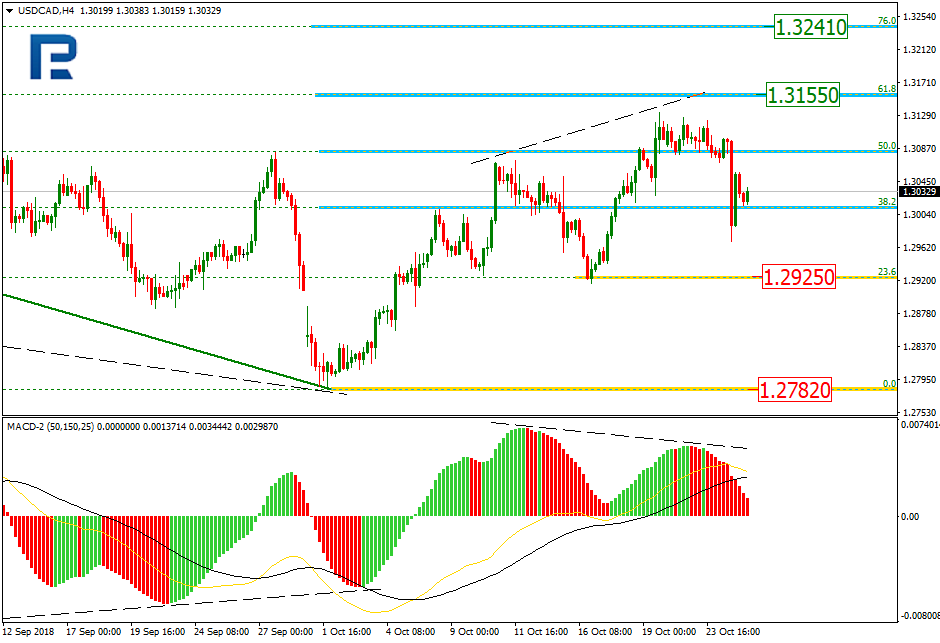
As we can see in the H4 chart, after being corrected by 50.0%, USDCAD is trying to reverse. However, if the uptrend continues, its targets will be the retracements of 61.8% and 76.0% at 1.3155 and 1.3241 respectively. The short-term support level is at 1.2925.
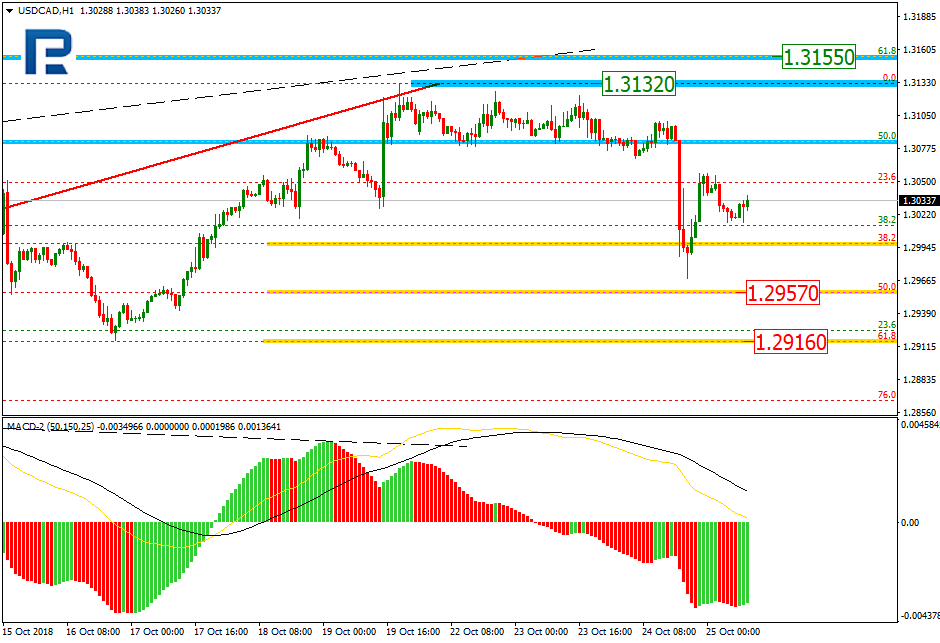
In the H1 chart, the divergence made the pair reverse and start a new downtrend, which has already reached the retracement of 38.2%. The next possible targets are the retracements of 50.0% and 61.8% at 1.2957 and 1.2916 respectively. If the price breaks the high at 1.3132, the ascending correction will continue.
Forecasts presented in this section only reflect the author’s private opinion and should not be considered as guidance for trading. RoboForex bears no responsibility for trading results based on trading recommendations described in these analytical reviews.