Fibonacci Retracements Analysis 25.06.2019 (EURUSD, USDJPY)
EURUSD, “Euro vs US Dollar”
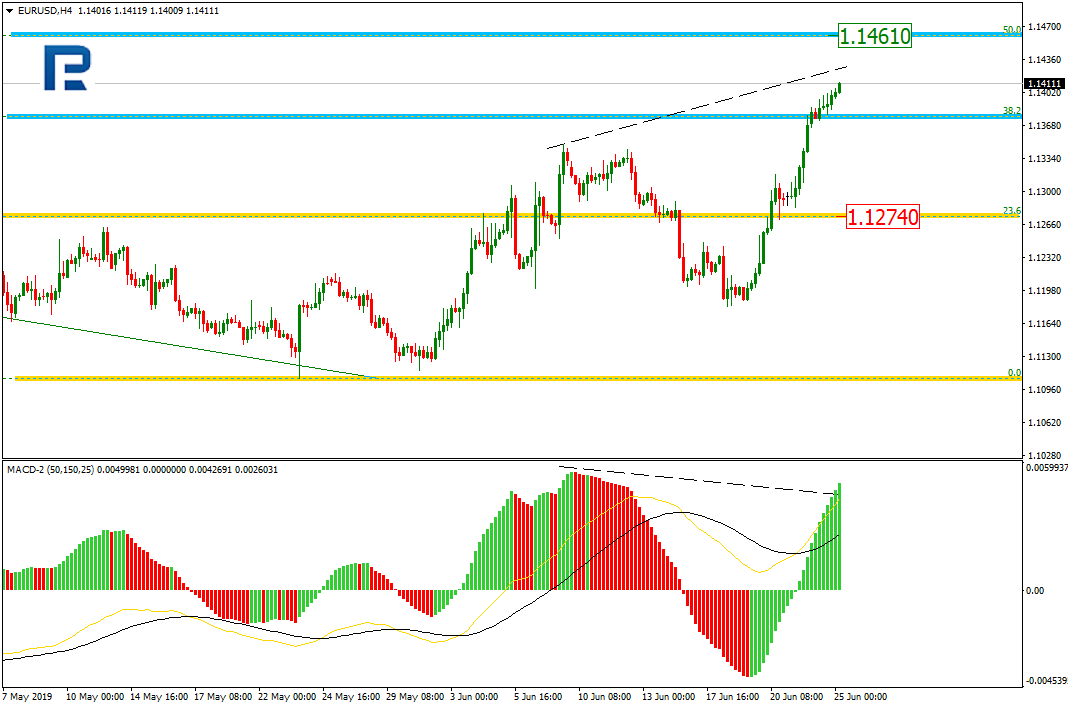
As we can see in the H4 chart, after breaking 38.2% fibo, EURUSD is moving towards 50.0% fibo at 1.1461. At the same time, there is divergence on MACD, which indicates a slowdown in the uptrend and a new mid-term descending impulse after the price reaches its upside targets. The support is at 23.6% fibo at 1.1274.

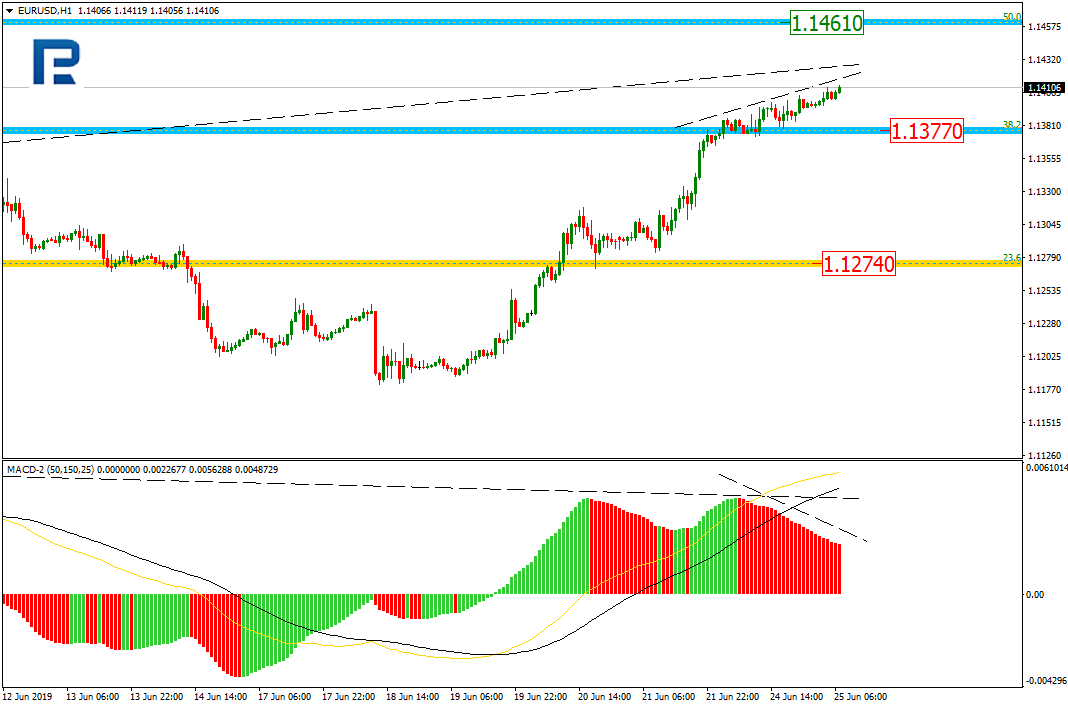
In the H1 chart, the pair is also trading upwards along with a local divergence on MACD, which may indicate a signal to reverse. The local support is 38.2% fibo at 1.1377.
USDJPY, “US Dollar vs. Japanese Yen”
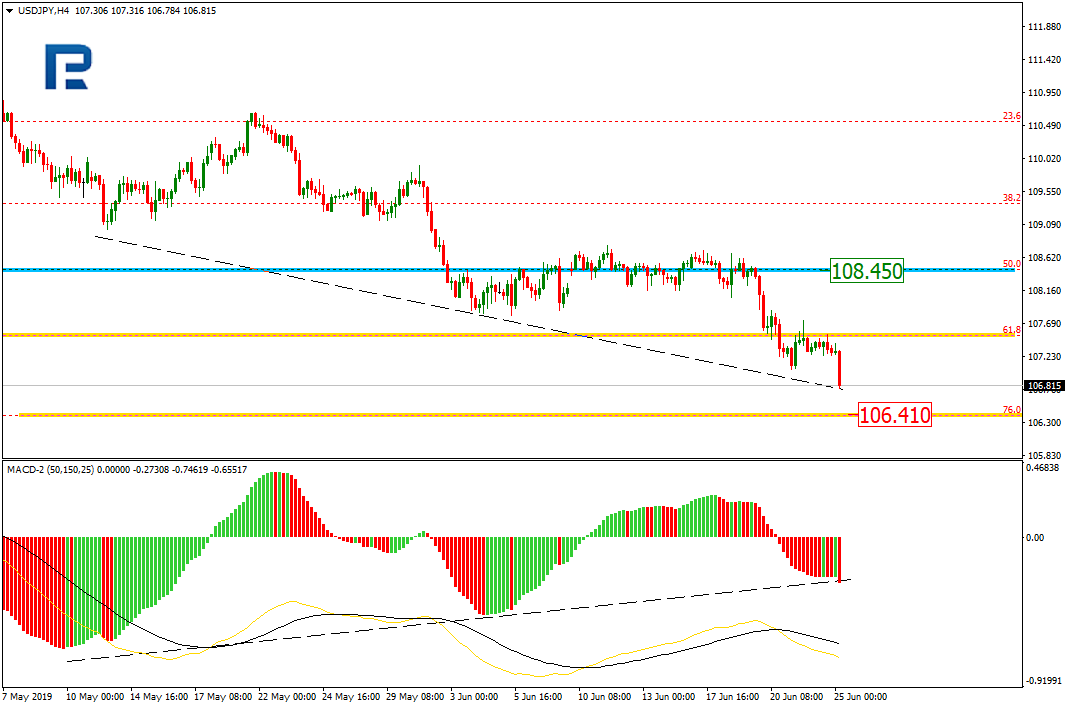
As we can see in the H4 chart, USDJPY is no longer trading sideways; after breaking 61.8% fibo, the pair is trading towards 76.0% at 106.41. At the same time, there is a convergence on MACD, which indicates a new pullback soon with the target at the resistance 108.45.
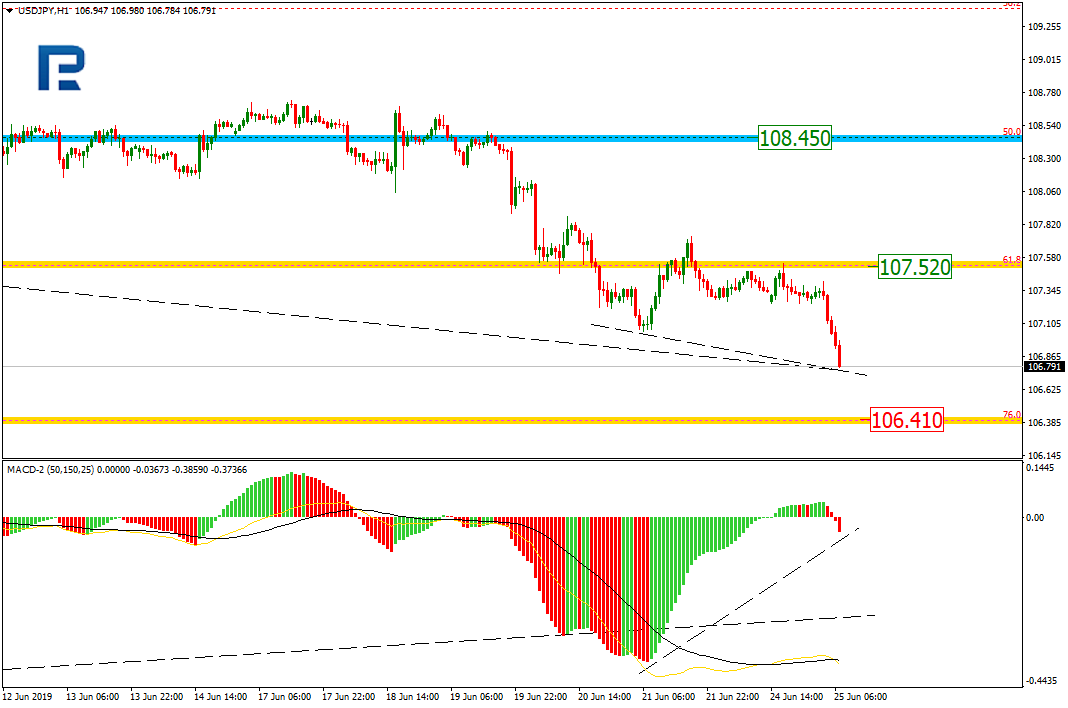
In the H1 chart, the pair is forming a descending impulse to reach 76.0 fibo at 106.41. However, there is a local convergence on MACD, which may indicate a trend reverse.
Forecasts presented in this section only reflect the author’s private opinion and should not be considered as guidance for trading. RoboForex bears no responsibility for trading results based on trading recommendations described in these analytical reviews.