Fibonacci Retracements Analysis 23.10.2018 (EURUSD, USDJPY)
EURUSD, “Euro vs US Dollar”
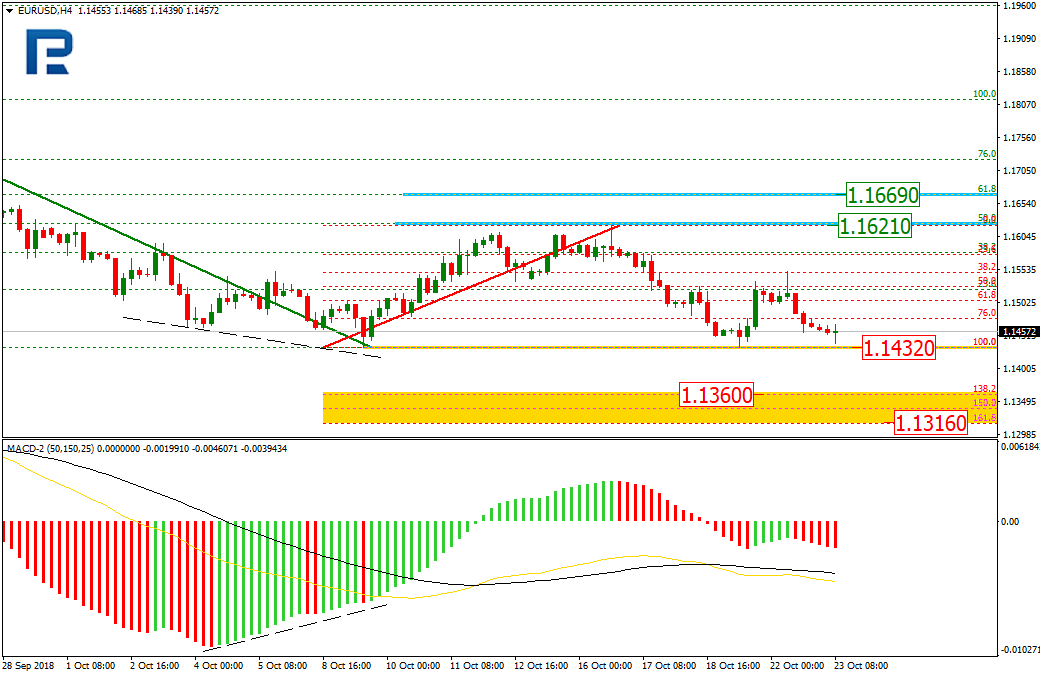
In the H4 chart, EURUSD is testing the support level at 1.1432. If the price breaks it, the instrument may continue falling towards the post-correctional extension area between the retracements of 138.2% and 161.8% at 1.1360 and 1.1316 respectively. The resistance level is the high at 1.1621.

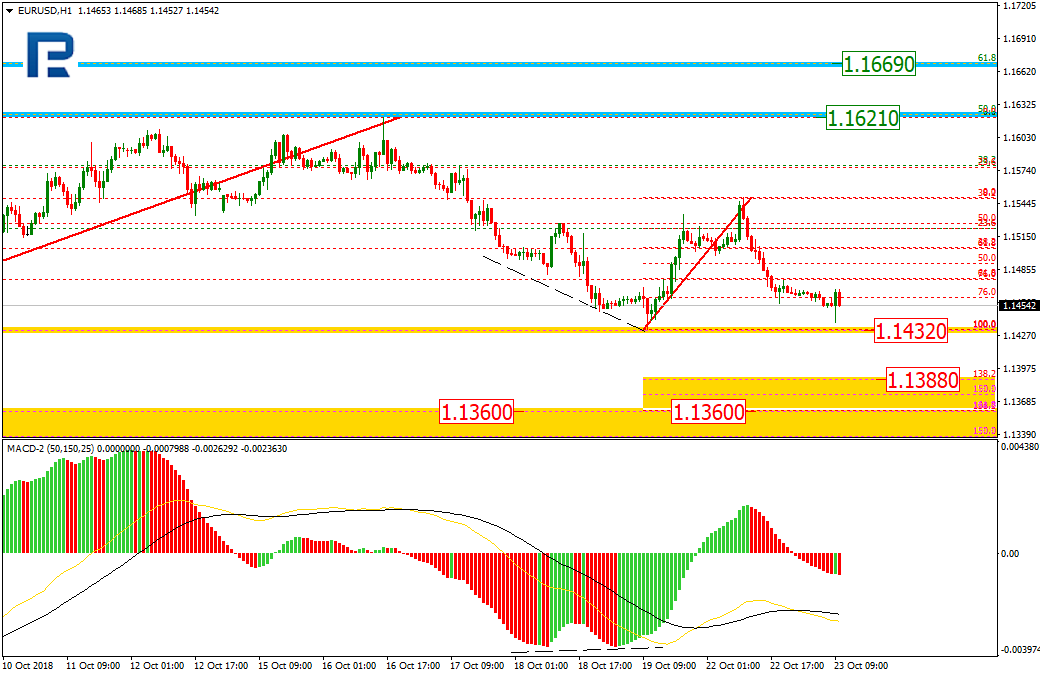
As we can see in the H1 chart, EURUSD is finishing the short-term correction and about to start a new impulse to the downside. In the nearest future, the price may continue falling towards the post-correctional extension area between the retracements of 138.2% and 161.8% at 1.1388 and 1.1360 respectively.
USDJPY, “US Dollar vs. Japanese Yen”
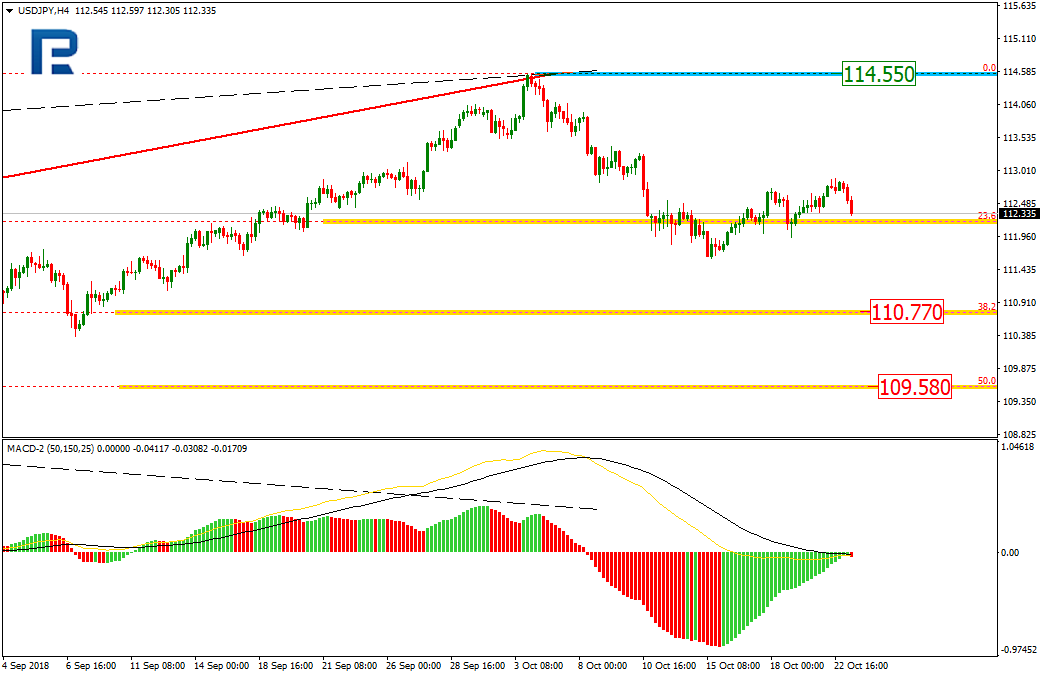
As we can see in the H4 chart, USDJPY is completing the short-term correction, which may be followed by a new descending impulse. The next downside targets may be the retracements of 38.2% and 50.0% at 110.77 and 109.58 respectively. The main resistance level is the high at 114.55.
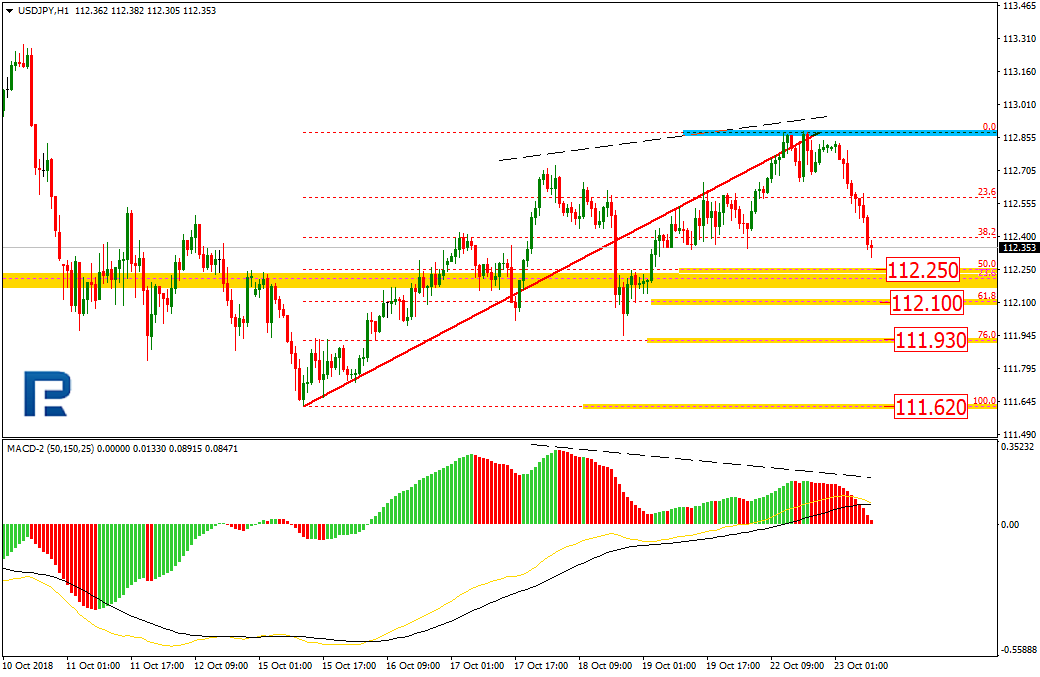
In the H1 chart, the convergence made the pair start a new decline. The possible downside targets are the retracements of 50.0%, 61.8%, and 76.0% at 112.25, 112.10, and 111.93 respectively. The main downside target and the support level are the low at 111.62.
Forecasts presented in this section only reflect the author’s private opinion and should not be considered as guidance for trading. RoboForex bears no responsibility for trading results based on trading recommendations described in these analytical reviews.