Fibonacci Retracements Analysis 21.08.2018 (EURUSD, USDJPY)
EURUSD, “Euro vs US Dollar”
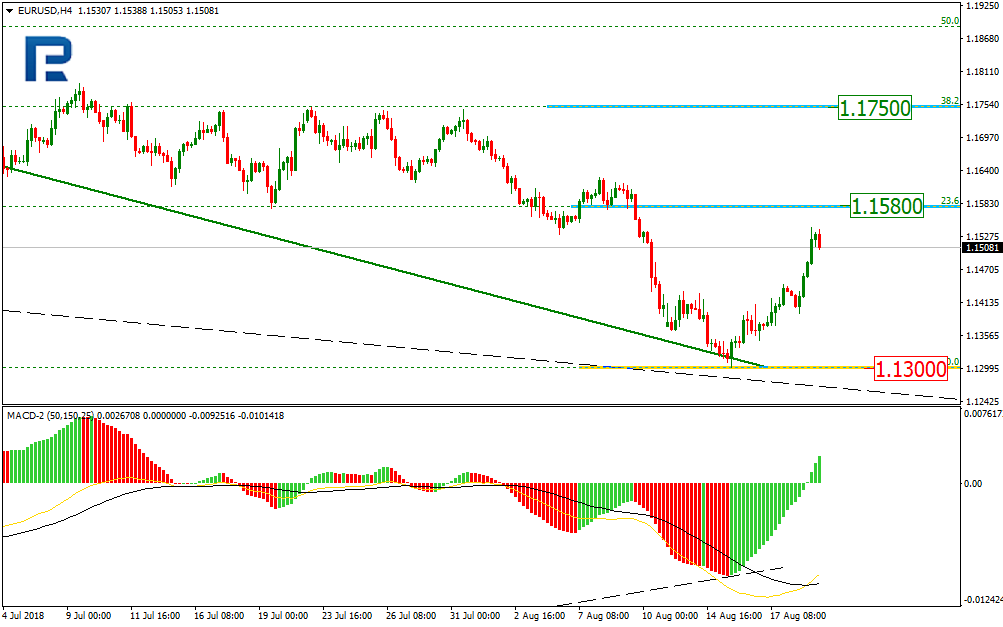
In the H4 chart, EURUSD is forming a new correction to the upside towards the retracement of 23.6% at 1.1580. The next upside target may be the retracement of 38.2% at 1.1750. The support level is the low at 1.1300.

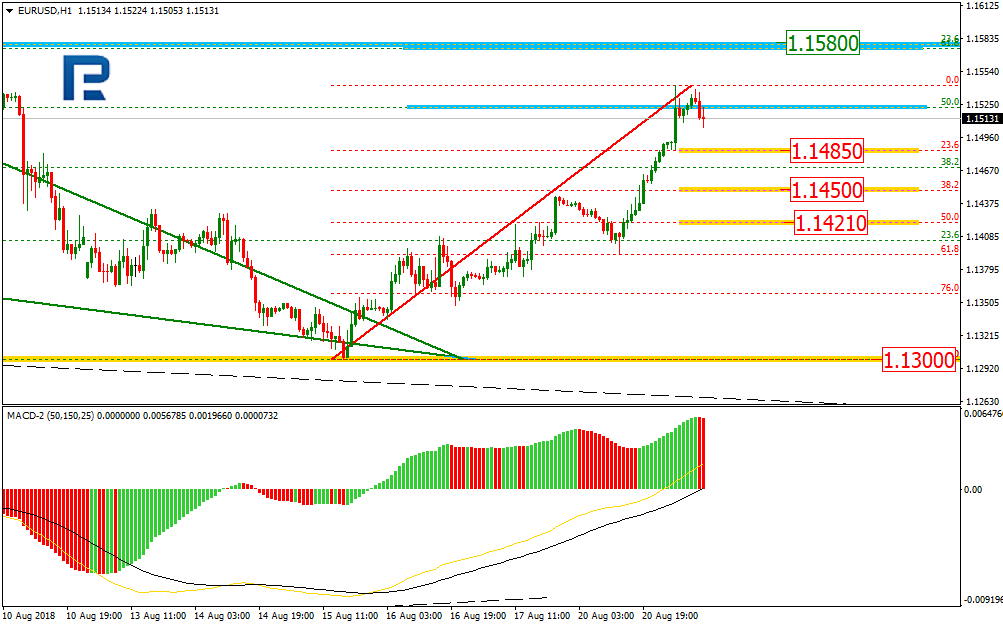
As we can see in the H1 chart, the pair has been corrected upwards by 50.0%. In the nearest future, the instrument may continue falling towards the retracements of 23.6%, 38.2%, and 50.0% at 1.1485, 1.1450, and 1.1421 respectively.
USDJPY, “US Dollar vs. Japanese Yen”
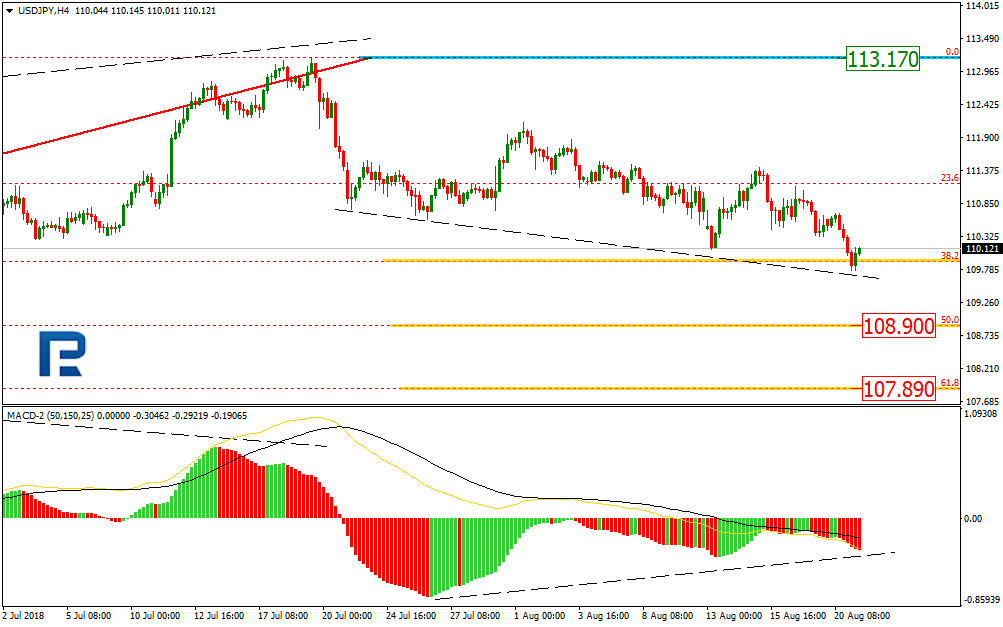
As we can see in the H4 chart, the divergence made USDJPY reverse and start a new correctional downtrend, which has already reached the retracement of 38.2% and may continue towards the retracements of 50.0% and 61.8% at 108.90 and 107.89 respectively. The resistance level is the high at 113.17. At the same time, one can see the convergence being formed, which may indicate a possible pullback in the future.
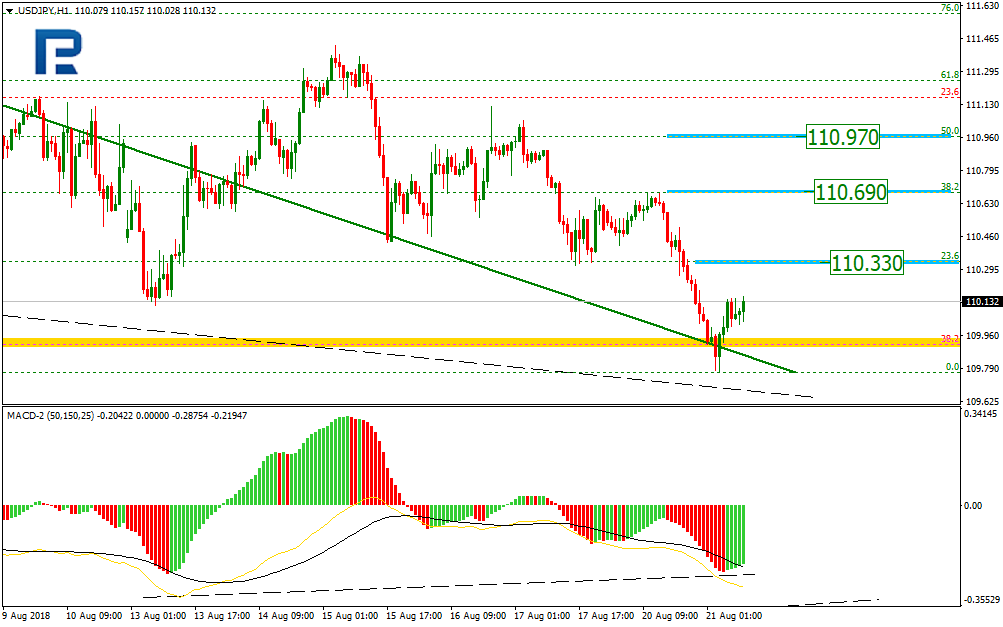
In the H1 chart, the convergence is being formed, which may indicate a new pullback towards the retracements of 23.6%, 38.2%, and 50.0% at 110.33, 110.69, and 110.97 respectively.
Forecasts presented in this section only reflect the author’s private opinion and should not be considered as guidance for trading. RoboForex bears no responsibility for trading results based on trading recommendations described in these analytical reviews.