Fibonacci Retracements Analysis 07.03.2019 (AUDUSD, USDCAD)
AUDUSD, “Australian Dollar vs US Dollar”
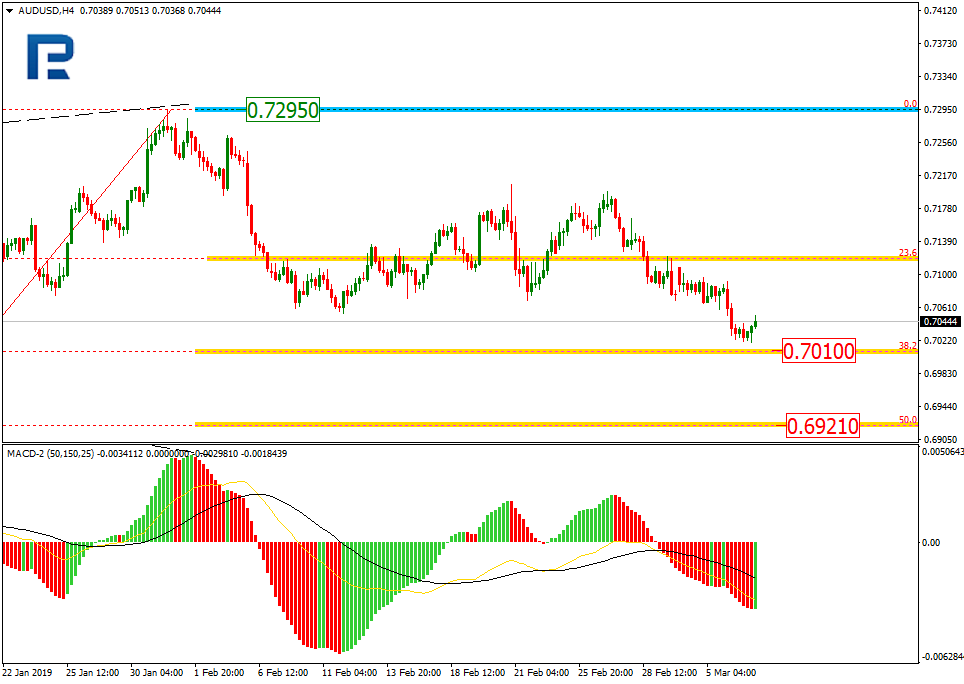
As we can see in the H4 chart, AUDUSD continues forming another descending wave. The resistance is the high still at 0.7295. The wave is getting closer to the retracements of 38.2% and 50.0% at 0.7010 and 0.6921 respectively.

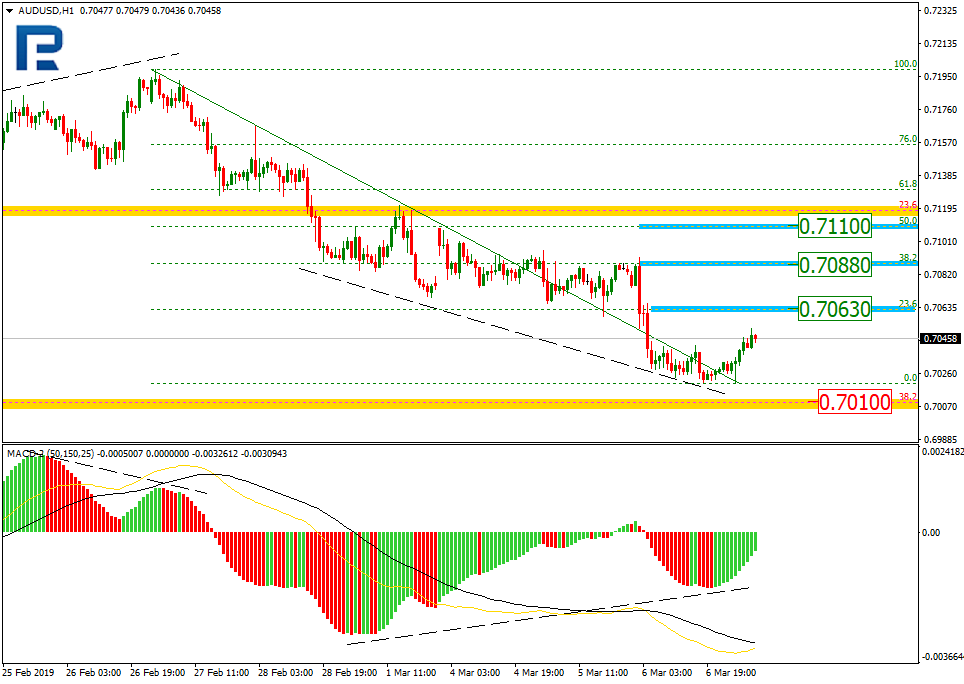
In the H1 chart, there is a convergence on MACD, which indicates a possible pullback. The targets of this pullback may be the retracements of 23.6%, 38.2%, and 50.0% at 0.7063, 0.7088, and 0.7110 respectively.
USDCAD, “US Dollar vs Canadian Dollar”
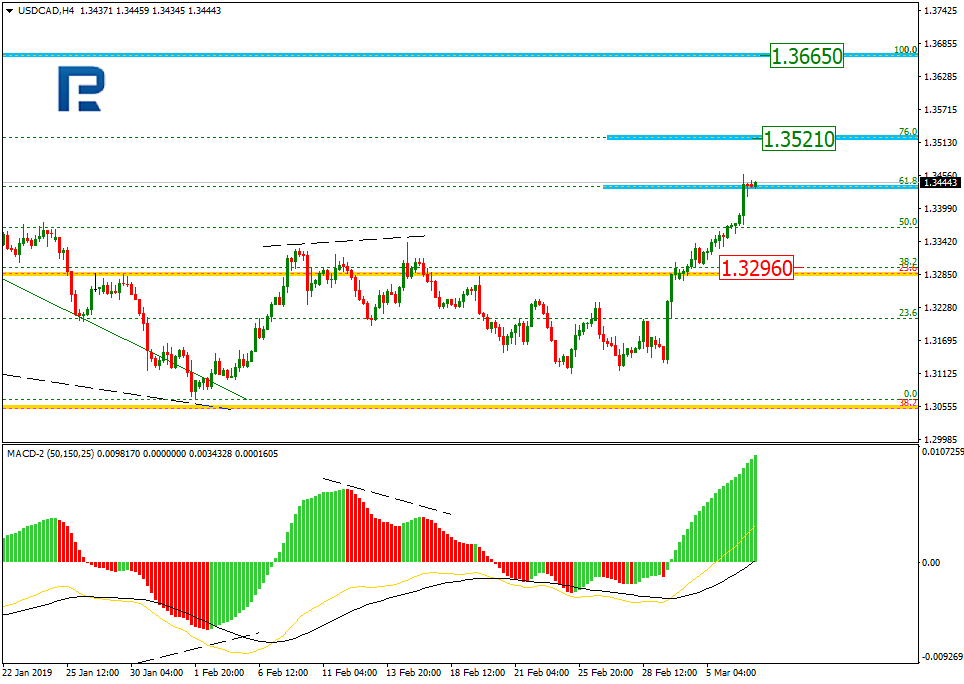
As we can see in the H4 chart, a new rising impulse has reached the retracement of 61.8%. If the price continues growing, the next targets will be retracement of 76.0% at 1.3521 and the high at 1.3665. The support level is the retracement of 38.2% at 1.3296.
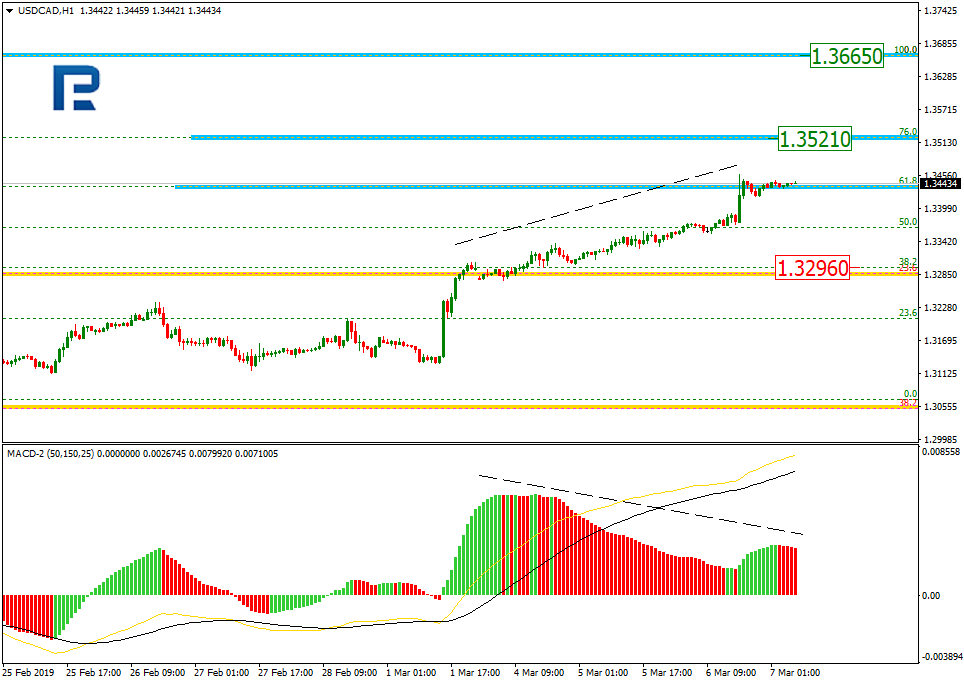
In the H1 chart, the price is trading upwards, but there is a divergence on MACD, which may indicate a reverse after the instrument reaches the retracement of 76.0% at 1.3521.
Forecasts presented in this section only reflect the author’s private opinion and should not be considered as guidance for trading. RoboForex bears no responsibility for trading results based on trading recommendations described in these analytical reviews.