Fibonacci Retracements Analysis 05.03.2019 (EURUSD, USDJPY)
EURUSD, “Euro vs US Dollar”
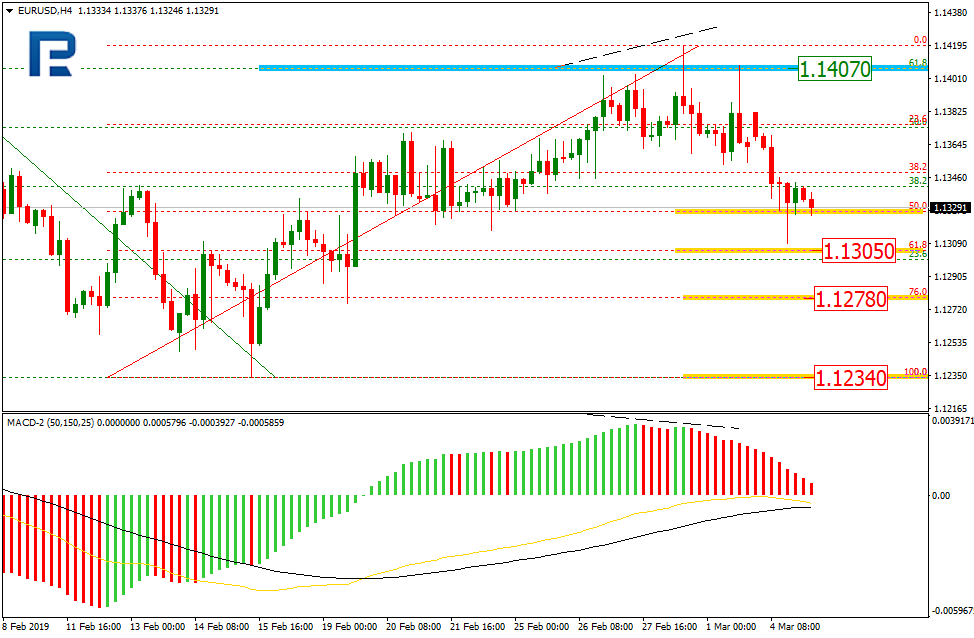
As we can see in the H4 chart, the convergence on MACD made EURUSD start a new descending correction, which has already reached the retracement of 50.0%. The next targets may be the retracements of 61.8% and 76.0% at 1.1305 and 1.1278 respectively. The key support level is the low at 1.1234.

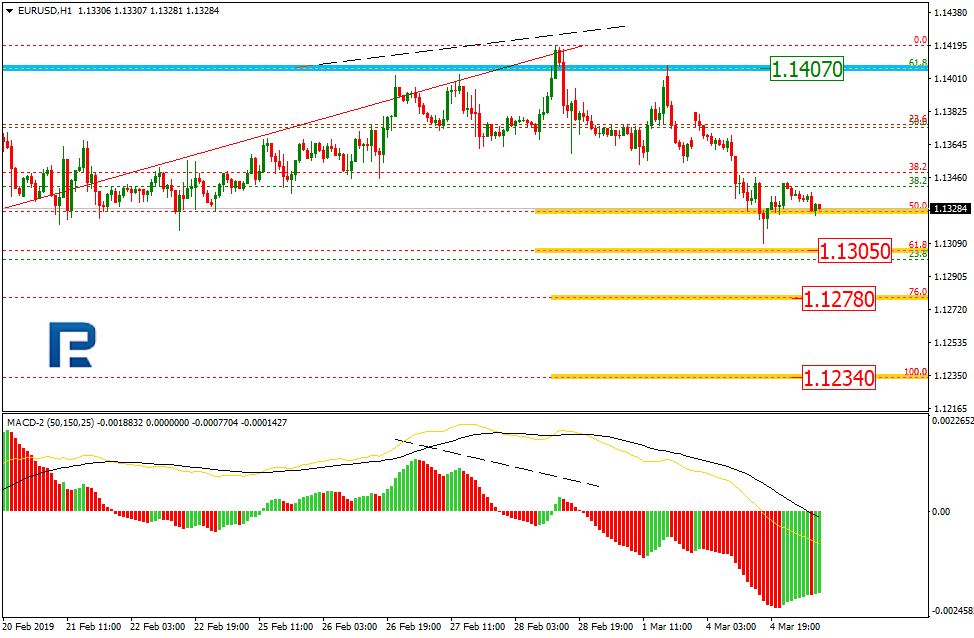
In the H1 chart, after reaching the retracement of 61.8% at 1.1305, EURUSD started a new short-term pullback.
USDJPY, “US Dollar vs. Japanese Yen”
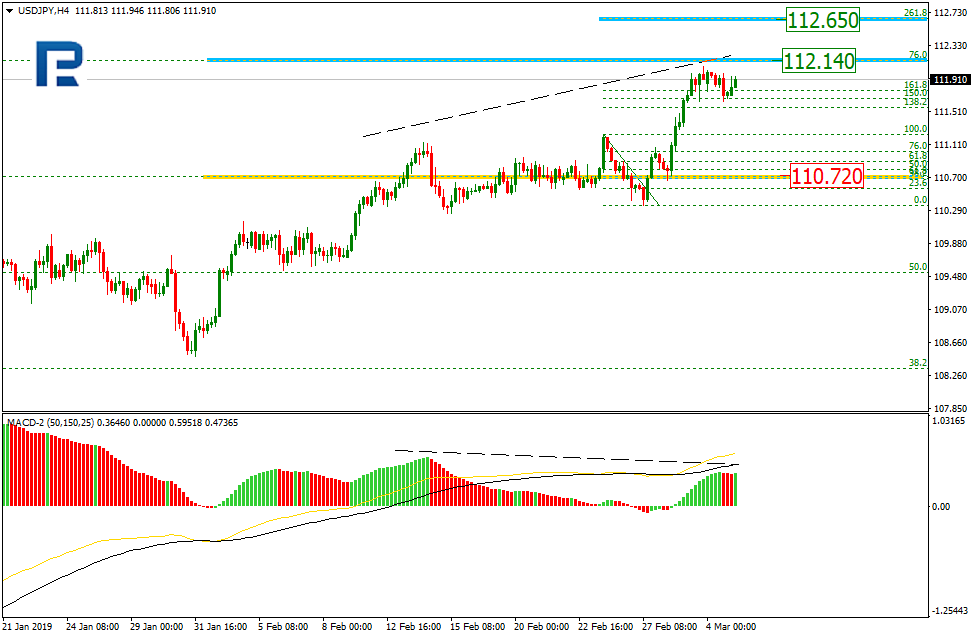
In the H4 chart, USDJPY is trading upwards and getting closer to the retracement of 76.0% at 112.14. After breaking it, the price may continue growing towards the post-correctional retracement of 261.8% at 112.65. The support level is at 110.72. At the same time, there is a divergence on MACD.
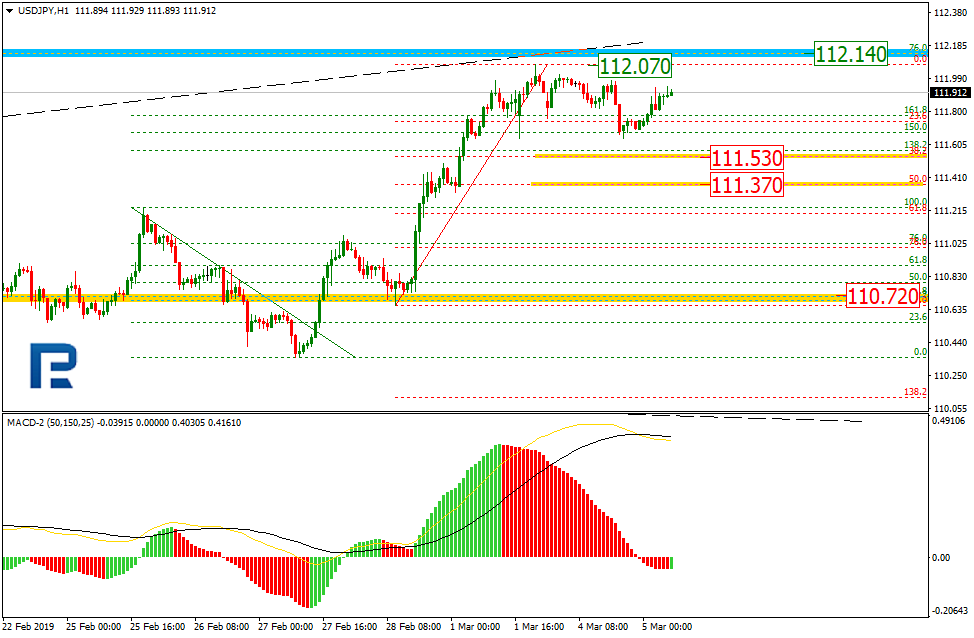
As we can see in the H1 chart, the pair has been corrected to the downside by 23.6%. The next targets may be the retracements of 38.2% and 50.0% at 111.53 and 111.376 respectively. The resistance level is the high at 112.07.
Forecasts presented in this section only reflect the author’s private opinion and should not be considered as guidance for trading. RoboForex bears no responsibility for trading results based on trading recommendations described in these analytical reviews.