Fibonacci Retracements Analysis 04.10.2018 (AUDUSD, USDCAD)
AUDUSD, “Australian Dollar vs US Dollar”
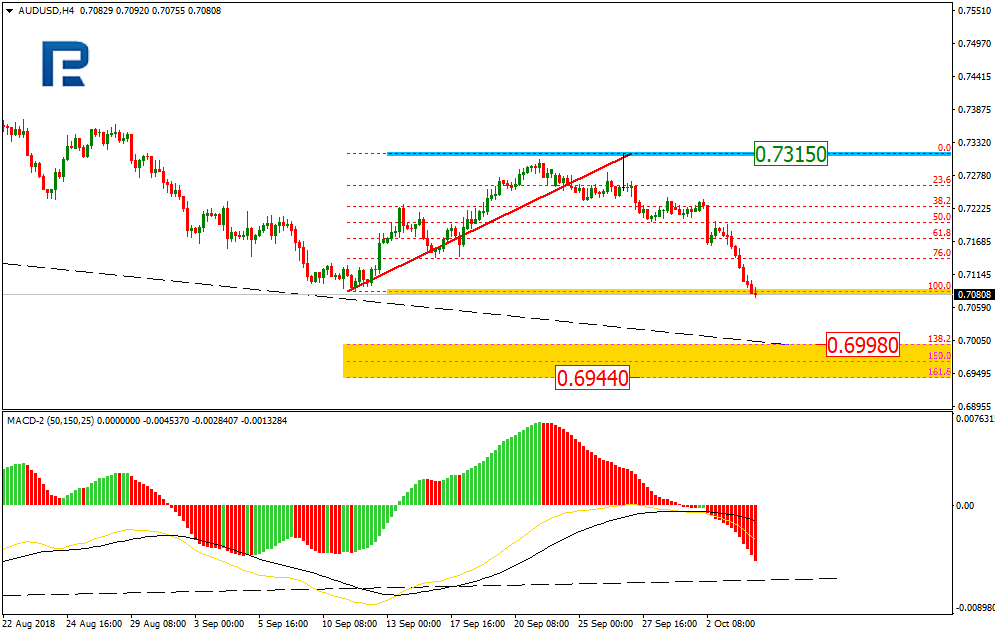
In the H4 chart, AUDUSD is forming another descending impulse inside the long-term downtrend; it has already broken the previous high. The possible targets may be inside the post-correctional extension area between the retracements of 138.2% and 161.8% at 0.6998 and 0.6944 respectively. The key resistance level is t 0.7315.

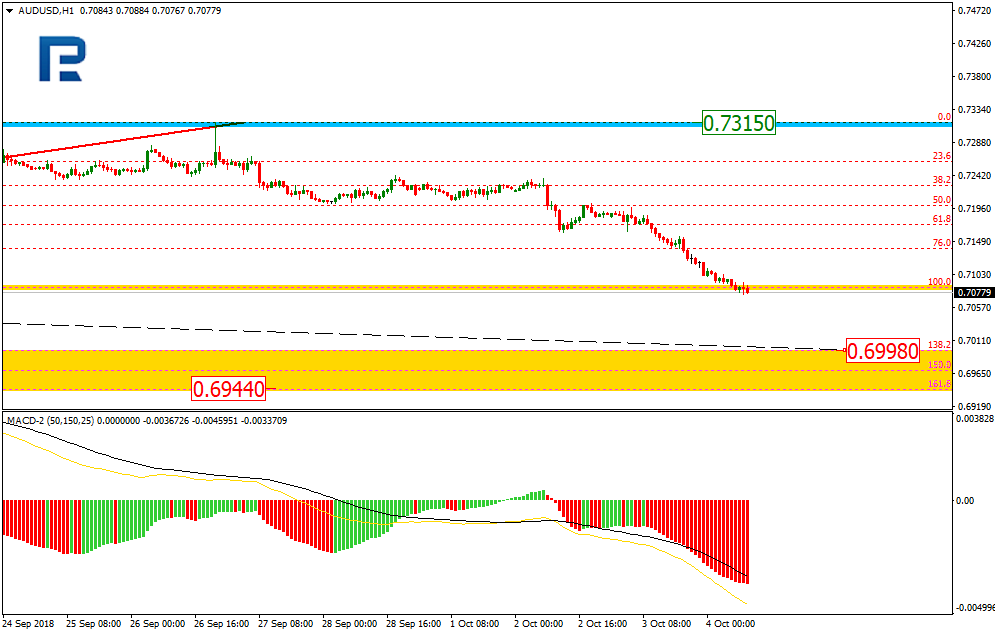
As we can see in the H1 chart, the pair is trading downwards to reach the post-correctional extension area.
USDCAD, “US Dollar vs Canadian Dollar”
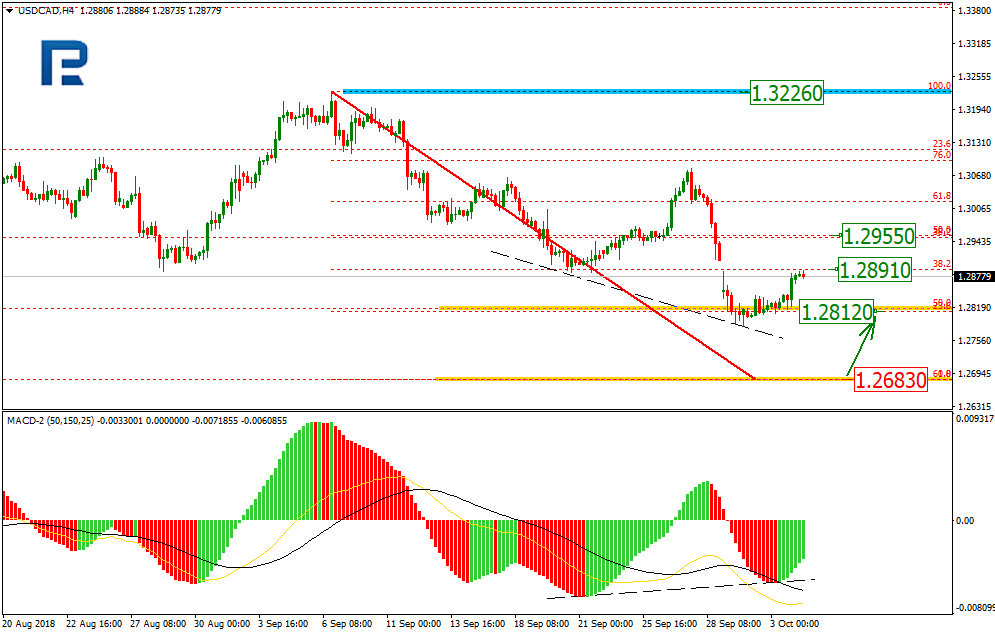
As we can see in the H4 chart, the downtrend has already reached the retracement of 50.5%. The next downside target is the retracement of 61.8% at 1.2683. At the same time, the convergence is being formed, which may indicate that after reaching its downside targets USDCAD may reverse and start a new pullback towards the retracements of 23.6%, 38.2%, and 50.0% at 1.2812, 1.2891, and 1.2955 respectively.
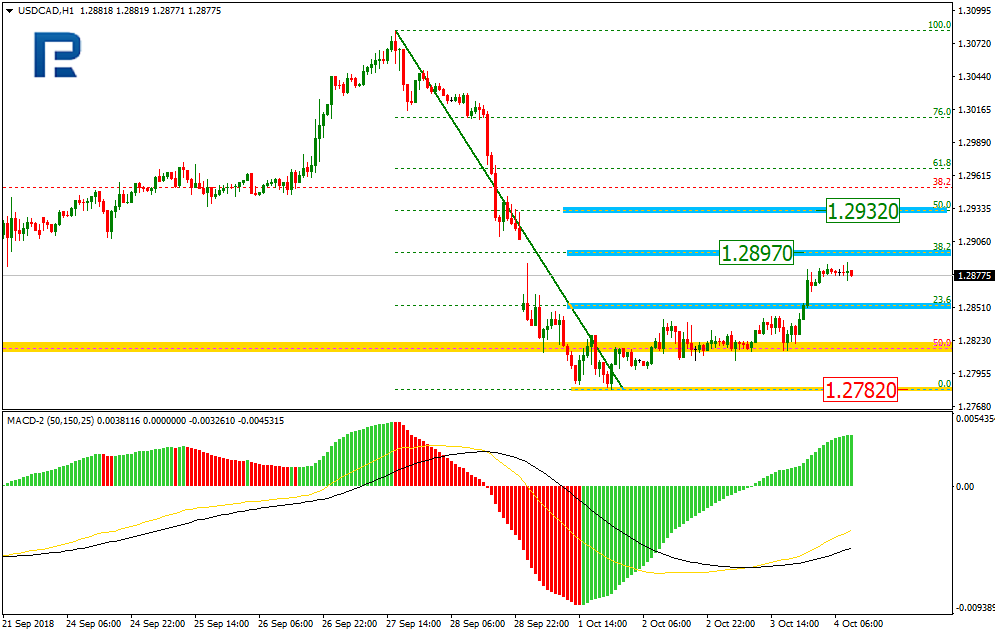
In the H1 chart, the correctional uptrend is heading towards the retracement of 50.0% at 1.2897.
Forecasts presented in this section only reflect the author’s private opinion and should not be considered as guidance for trading. RoboForex bears no responsibility for trading results based on trading recommendations described in these analytical reviews.