Fibonacci Retracements Analysis 02.10.2018 (EURUSD, USDJPY)
EURUSD, “Euro vs US Dollar”
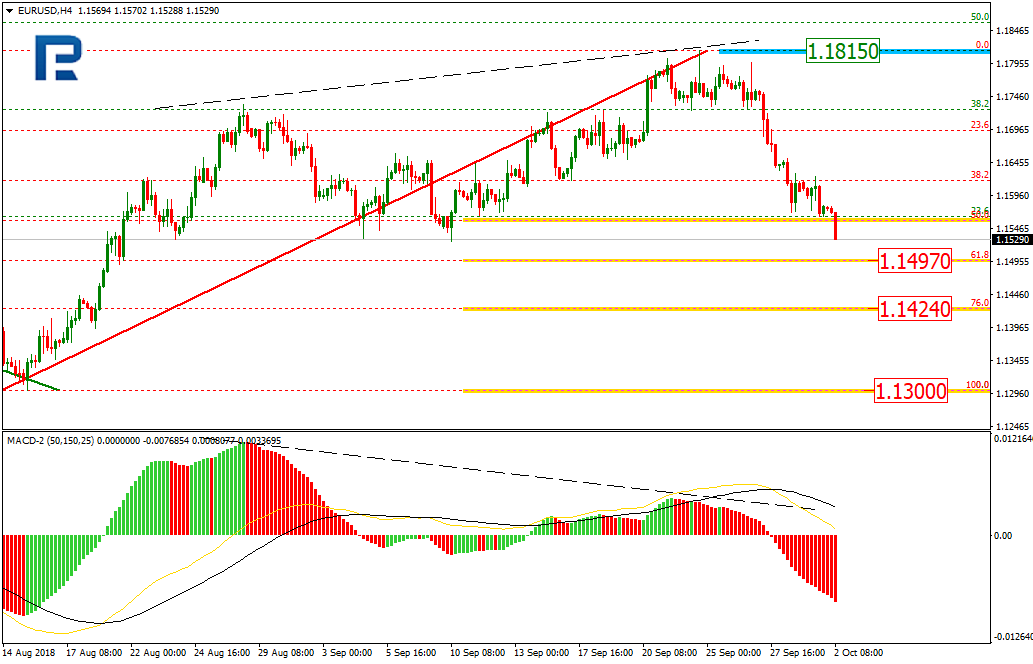
In the H4 chart, the divergence made EURUSD reverse and start a new impulse, which is moving to the downside steadily and has already reached the retracement of 50.0%. The next possible target may be the retracements of 61.8 and 76.0% at 1.1497 and 1.1424 respectively. The main downside target is this year’s low at 1.3000. The resistance level is the high at 1.1815.

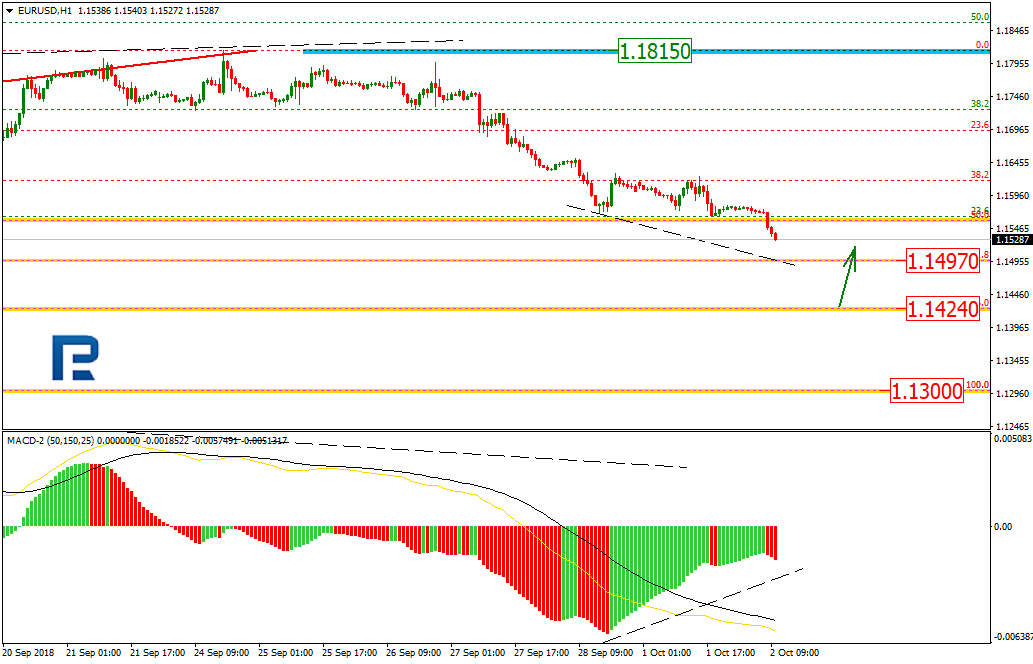
As we can see in the H1 chart, the convergence is being formed, which may indicate a possible pullback after the price reached the retracement of 76.0% at 1.1424.
USDJPY, “US Dollar vs. Japanese Yen”
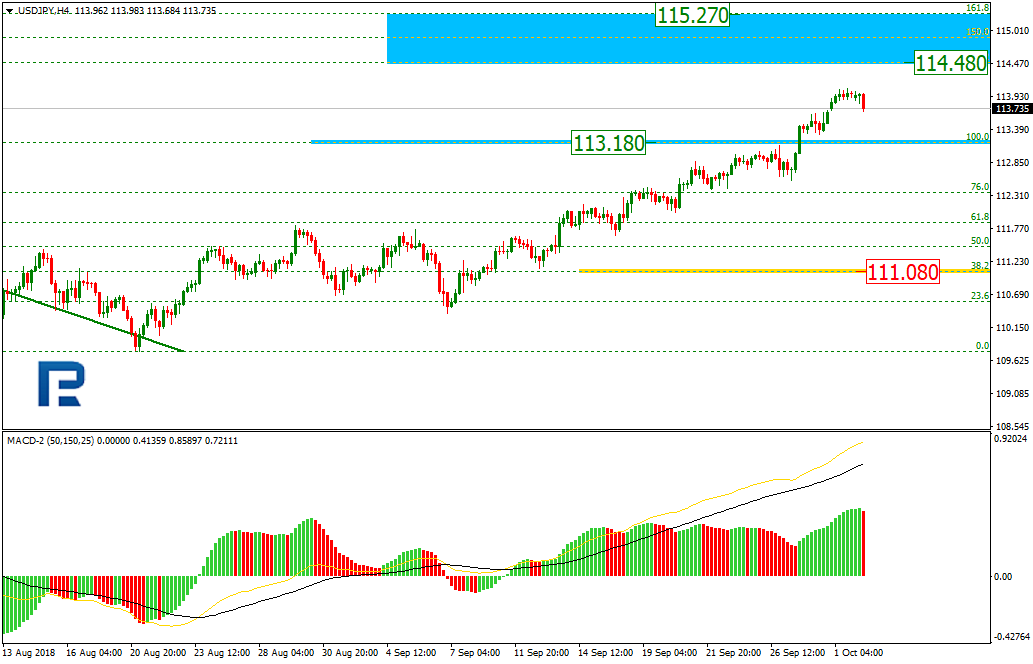
As we can see in the H4 chart, USDJPY has broken the previous long-term high. The next upside targets may be inside the post-correctional extension area between the retracements of 138.2% and 161.8% at 114.48 and 115.27 respectively. In the nearest future, the instrument may return to 113.18. The main support level is at 111.08.
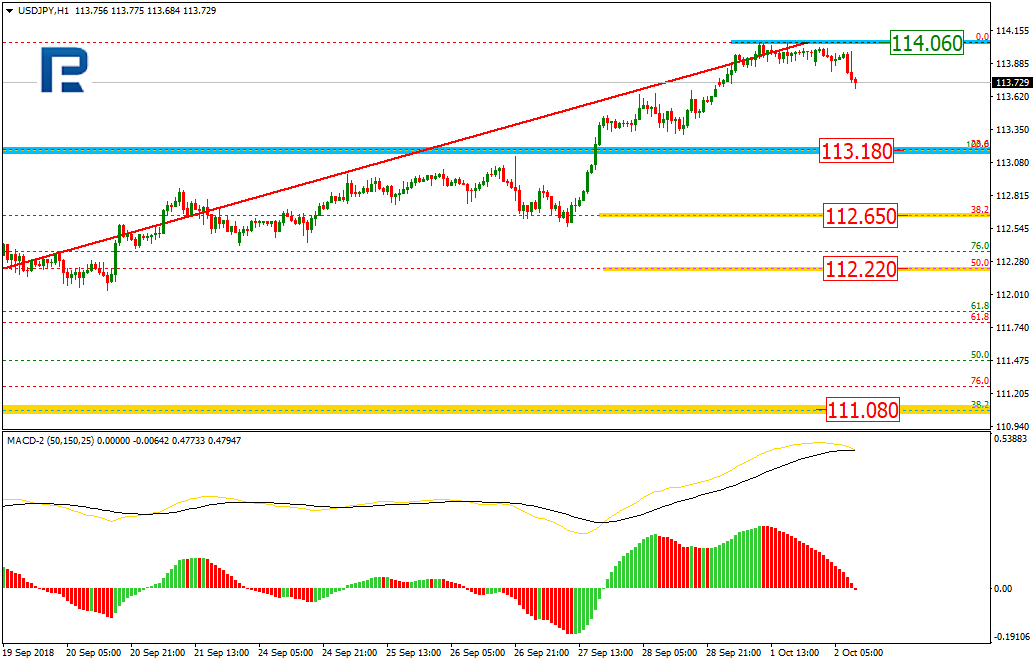
In the H1 chart, the pair is trading upwards. However, the price may yet start a new pullback. In this case, the possible targets will be the retracements of 23.6%, 38.2%, and 50.0% at 113.18, 112.65, and 112.22 respectively. The resistance level is the high at 114.06.
Forecasts presented in this section only reflect the author’s private opinion and should not be considered as guidance for trading. RoboForex bears no responsibility for trading results based on trading recommendations described in these analytical reviews.