Fibonacci Retracements Analysis 01.10.2018 (GOLD, USDCHF)
XAUUSD, “Gold vs US Dollar”
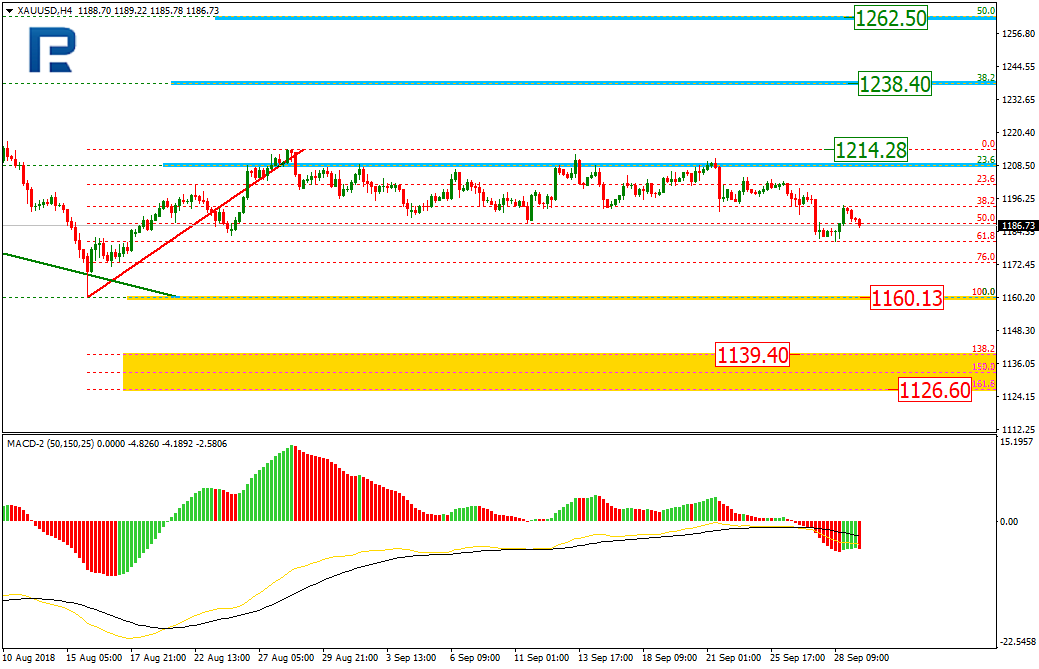
As we can see in the H4 chart, XAUUSD is trying to stop its correctional sideways movement and resume falling. If the price breaks the short-term low at 1160.13, the pair may move downwards to reach the post-correctional extension area between the retracements of 138.2% and 161.8% at 1139.40 and 1126.60 respectively. However, if the instrument breaks the high at 1214.28, the price may continue trading upwards to reach the retracements of 38.2% and 50.0% at 1238.40 and 1262.50 respectively.

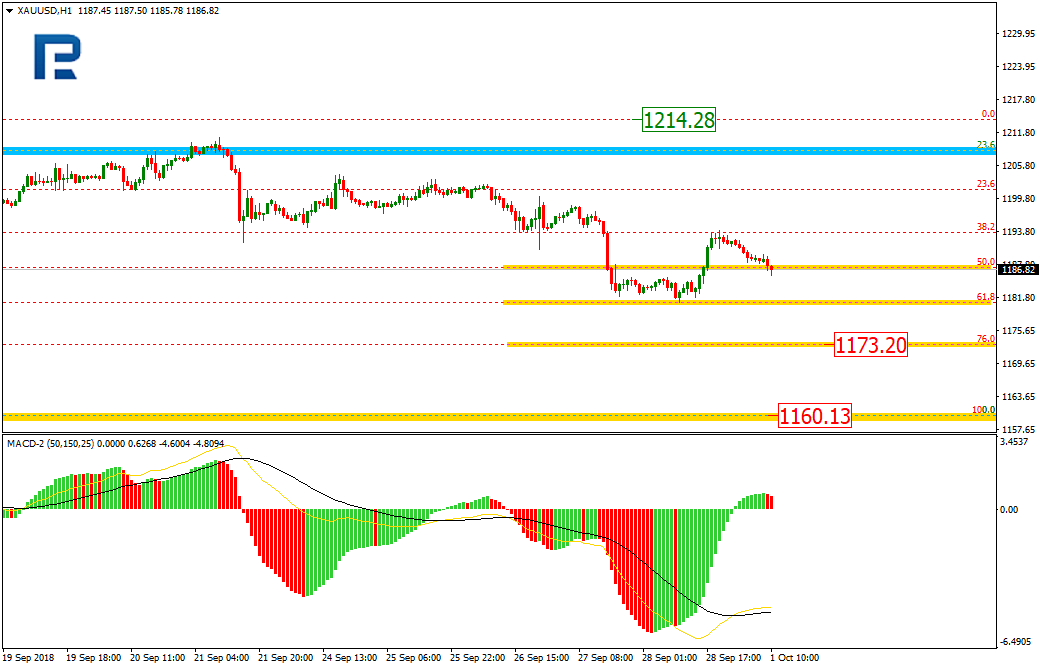
In the H1 chart, the pair is forming a new descending impulse. The next target is the retracement of 76.0% at 1173.20.
USDCHF, “US Dollar vs Swiss Franc”
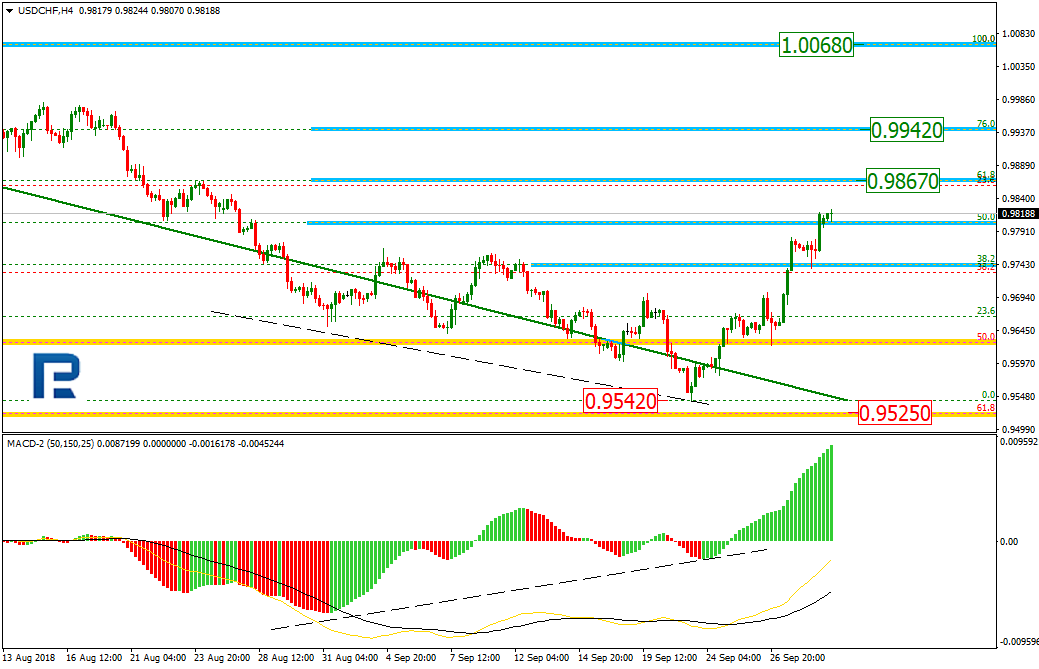
As we can see in the H4 chart, the USDCHF completed the downtrend at the retracement of 61.8% at 0.9525 and then started a new uptrend, which has already reached the retracement of 50.0%. The next upside targets may be the retracements of 61.8% and 76.0% at 0.9867 and 0.9942 respectively. The support level is the low at 0.9542.
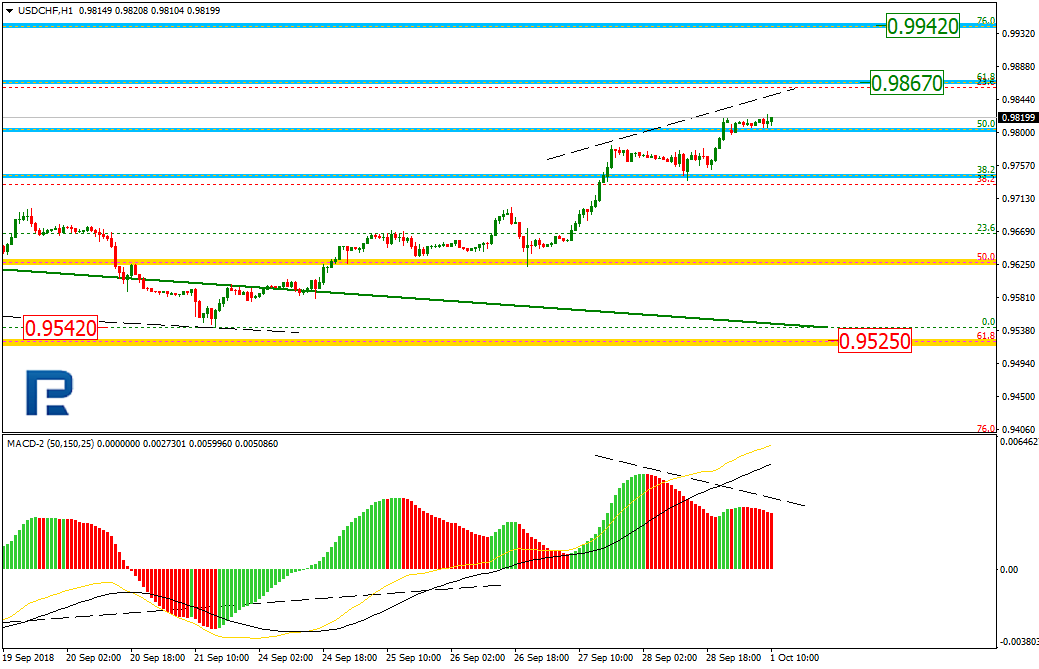
In the H1 chart, the pair is trading upwards to reach the retracement of 61.8% at 0.9867. At the same time, the divergence is being formed, which may indicate a new pullback after the instrument reaches its upside targets.
Forecasts presented in this section only reflect the author’s private opinion and should not be considered as guidance for trading. RoboForex bears no responsibility for trading results based on trading recommendations described in these analytical reviews.