Fibonacci Retracements Analysis 01.07.2019 (GOLD, USDCHF)
XAUUSD, “Gold vs US Dollar”
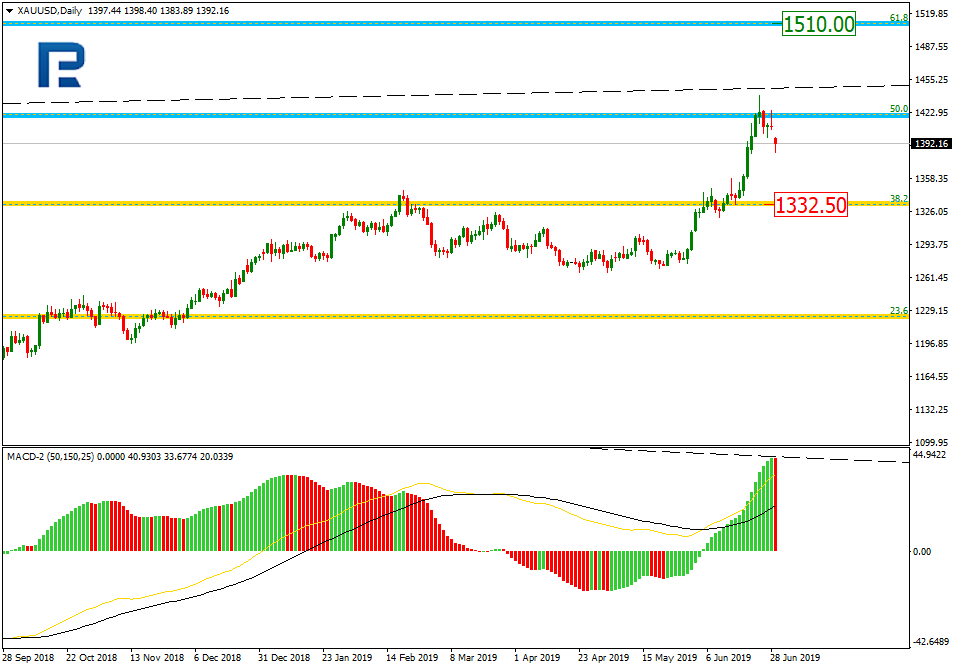
As we can see in the daily chart, the divergence made XAUUSD made reverse after reaching long-term 50.0% fibo and start a new decline. The downside target is short-term 38.2% fibo at 1332.50. Right now, it’s too early to think about a reverse. After finishing this descending correction, the price is expected to start another rising wave towards 61.8% fibo at 1510.00.

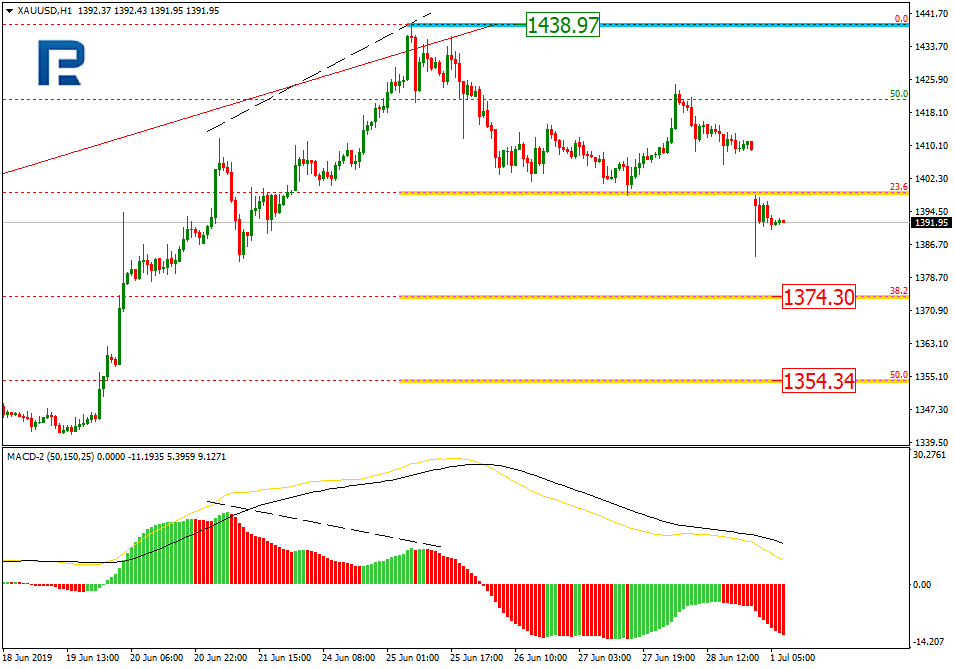
The H1 chart shows more detailed structure of the current correction. After breaking 23.6% fibo, the instrument may fall towards 38.2% and 50.0% fibo at 1374.30 and 1354.34 respectively. The resistance is the high at 1438.97.
USDCHF, “US Dollar vs Swiss Franc”
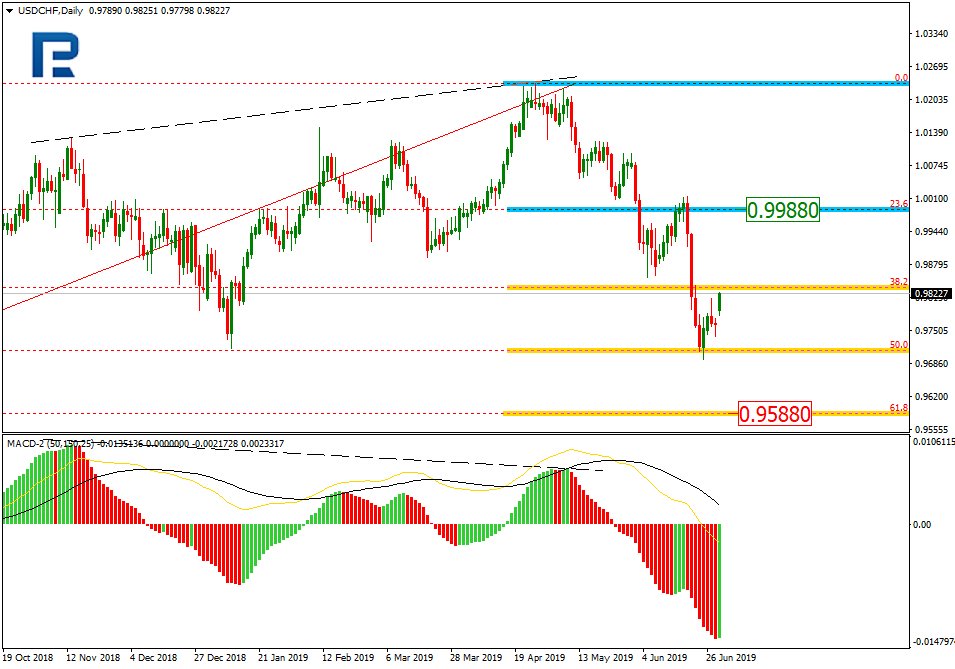
As we can see in the daily chart, after reaching 50.0% fibo, USDCHF is forming a new pullback. The resistance is at 23.6% fibo at 0.9988. After completing the pullback, the price may fall towards 61.8% fibo at 0.9588.
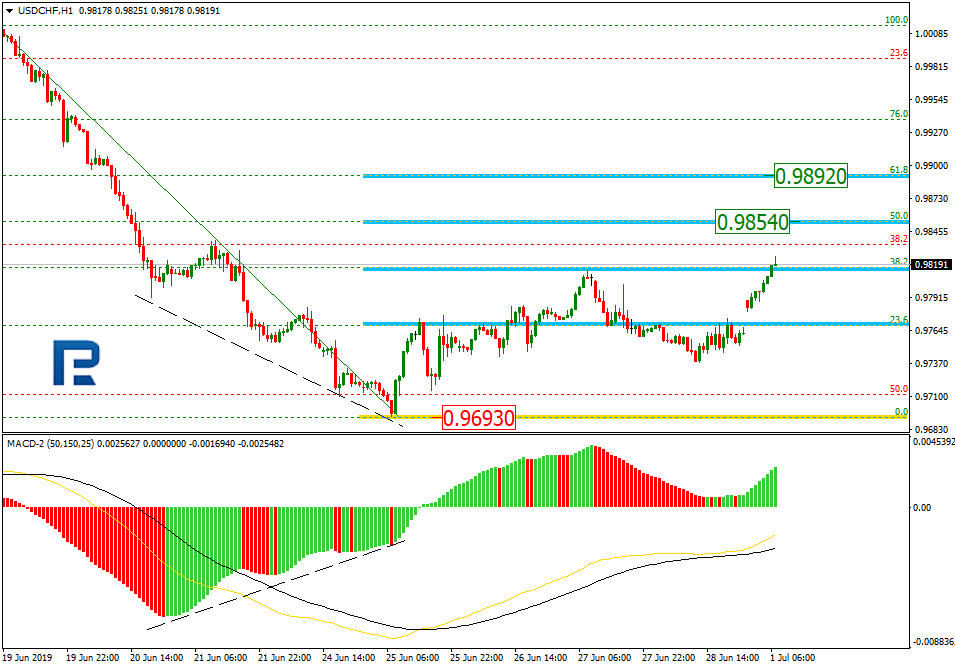
In the H1 chart, the correctional up trend continues; the pair has already reached 38.2% fibo and may continue growing towards 50.0 and 61.8% fibo at 0.9854 and 0.9892 respectively. The support is the low at 0.9693.
Forecasts presented in this section only reflect the author’s private opinion and should not be considered as guidance for trading. RoboForex bears no responsibility for trading results based on trading recommendations described in these analytical reviews.