Japanese Candlesticks Analysis 20.03.2018 (GOLD, NZDUSD)
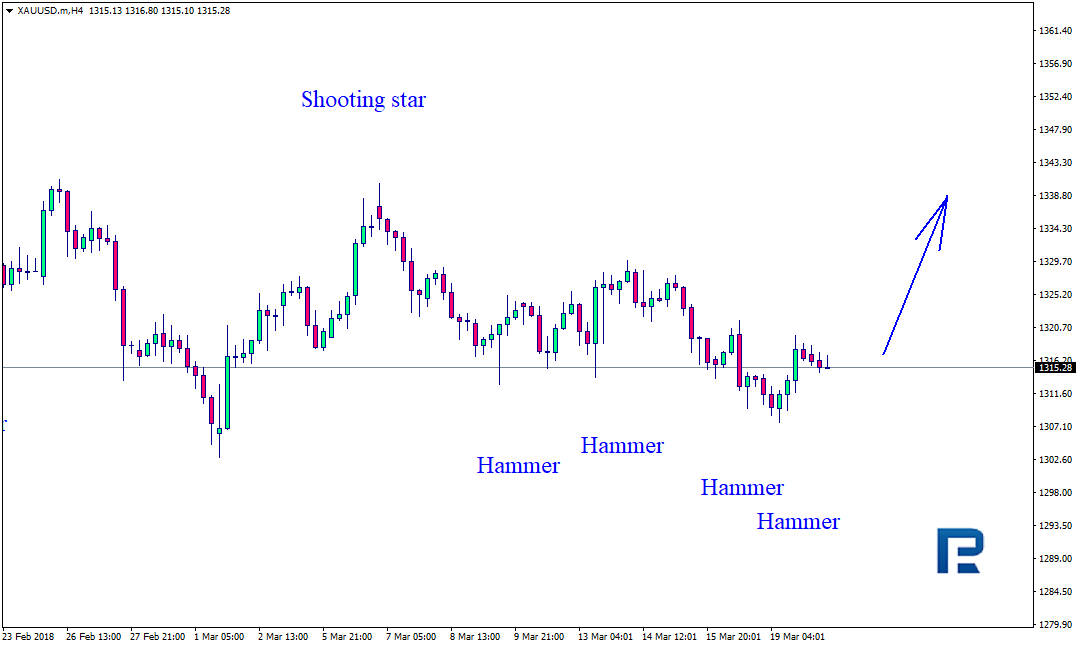
XAUUSD, “Gold vs US Dollar”
As we can see in the H4 chart, XAUUSD continues trading at the support level and forming Hammer reversal patterns. These patterns indicate that the instrument may trade sideways for a while, but then rebound from the support level and then resume moving to the upside.

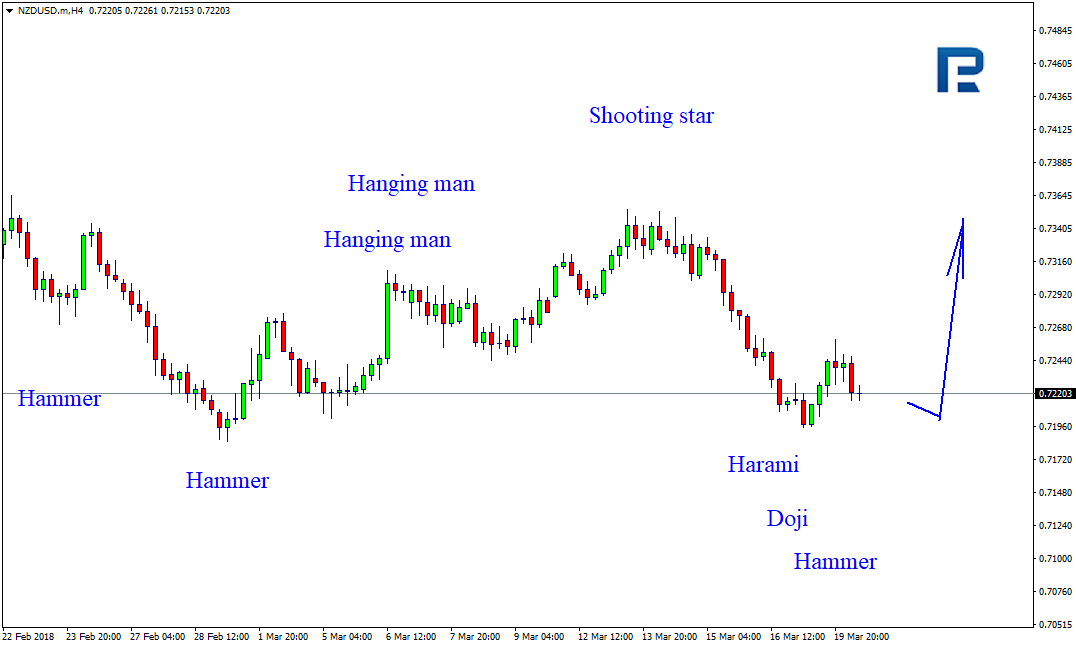
NZDUSD, “New Zealand vs. US Dollar”
As we can see in the H4 chart, after reaching the support level, NZDUSD has formed Harami, Doji, and Hammer reversal patterns there. At the moment, it may be assumed that the instrument may rebound from the support level and resume its ascending movement towards the resistance one.
RoboForex Analytical Department
Forecasts presented in this section only reflect the author’s private opinion and should not be considered as guidance for trading. RoboForex bears no responsibility for trading results based on trading recommendations described in these analytical reviews.