Wave Analysis 23.01.2017 (EUR/USD, GBP/USD, USD/JPY, AUD/USD)
EUR USD, “Euro vs US Dollar”
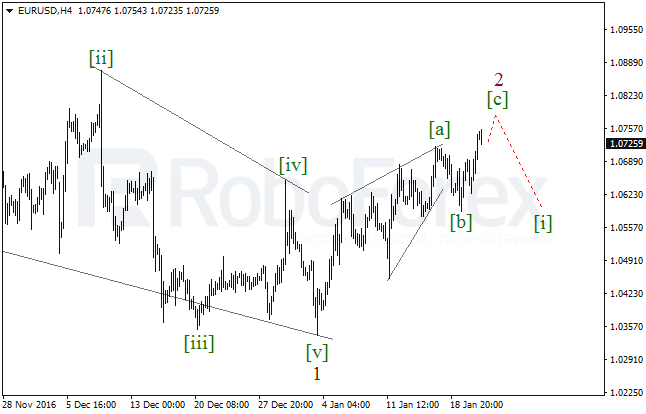
The EUR/USD pair is still being corrected in the wave 2, which is taking the form of the zigzag. At the moment, the market is forming the ascending impulse in the wave [c] of 2. In the nearest future, the price may continue growing, but later it is expected to reverse and start falling in the wave [i] of 3.
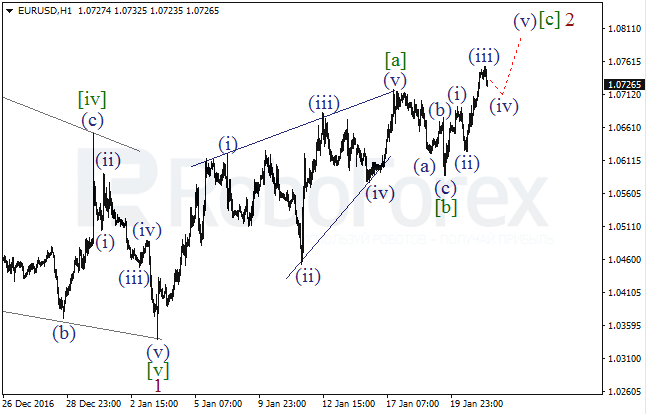
More detailed structure is shown on the H1 chart. The wave [b] turned out to be quite short and took the form of the zigzag. On a shorter timeframe, the price completed the third wave and started a new local correction, which may later be followed by another growth in the wave (v) of [c].
GBP USD, “Great Britain Pound vs US Dollar”
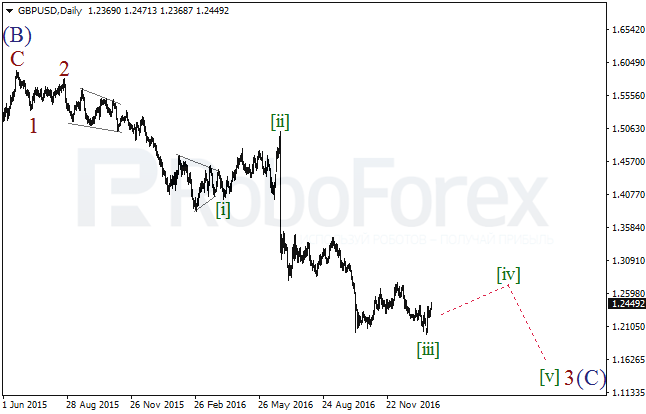
Possibly, the GBP/USD pair is about to start a long correction. Earlier, the wave [ii] took about two months and a half. As a result, the price may consolidate in the wave [iv] until the late March or early April.
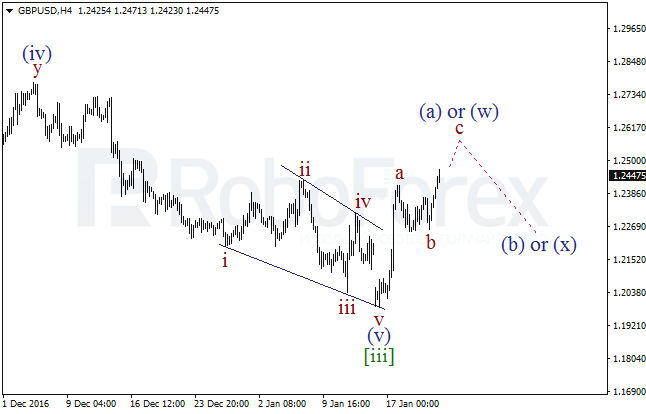
As we can see at the H4 chart, the price completed the wave (v) of [iii] in the form of the diagonal triangle. Probably, right now the price is forming the ascending zigzag, which may be the wave (a) or (w). After finishing the impulse in the wave c, the market may start a short-term decline.
USD JPY, “US Dollar vs Japanese Yen”
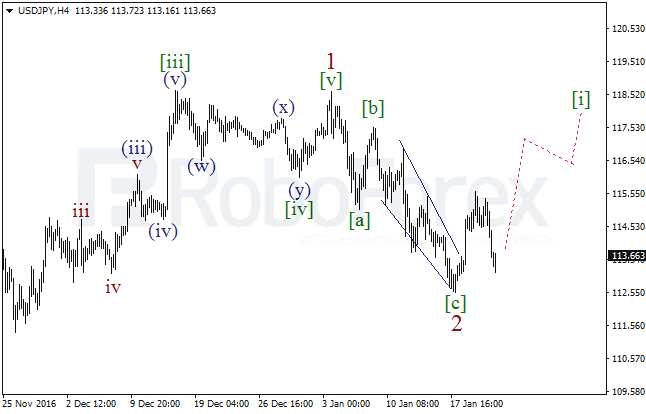
It’s highly likely that the USD/JPY pair completed the wave 2 took the form of the zigzag with the diagonal triangle[c] inside it. As a result, in the future the market may resume growing and move upwards in the wave [i].
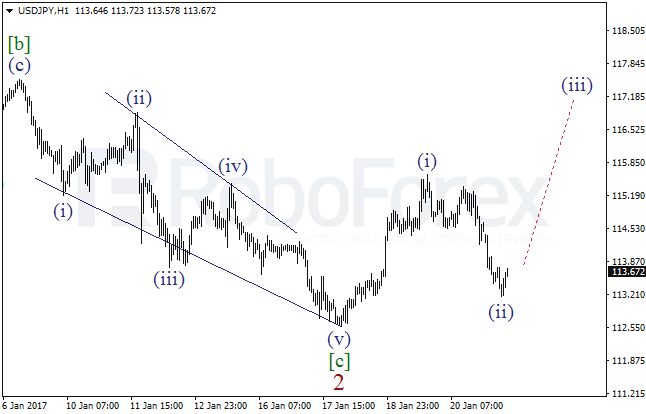
As we can see at the H1 chart, after finishing the wave [c], the pair formed the ascending impulse in the wave (i). It looks like right now the price is completing the local correction in the wave (ii). Consequently, in the nearest future the market may resume moving upwards in the wave (iii) of [i].
AUD USD, “Australian Dollar vs US Dollar”
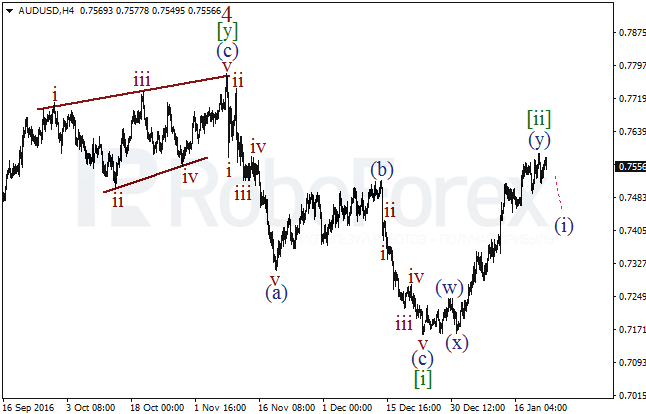
Possibly, the wave 5 is taking the form of the diagonal triangle with the zigzag[i] inside it. It looks like the wave [ii] took the form of the double zigzag. However, to confirm the wave [iii], the price has to form the descending impulse in the wave (i).
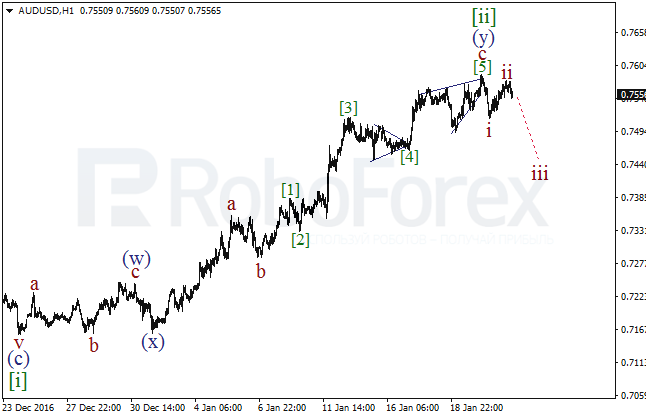
Probably, last week the pair completed the diagonal triangle in the wave [5] of c and then formed the bearish impulse in the wave i along with the correctional wave ii. It’s highly likely that during the next several hours the market may start falling in the wave iii of (i).
RoboForex Analytical Department
Forecasts presented in this section only reflect the author’s private opinion and should not be considered as guidance for trading. RoboForex bears no responsibility for trading results based on trading recommendations described in these analytical reviews.