Wave Analysis 19.05.2017 (EUR/USD, GBP/USD, USD/JPY, AUD/USD)
EUR USD
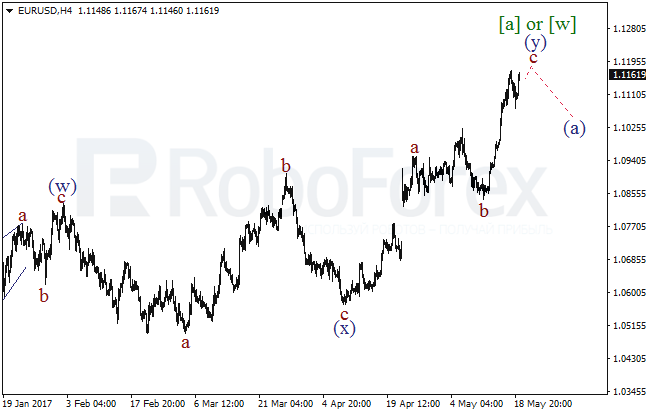
The EUR/USD pair is trading its local highs. Thus, it is not improbable that the double zigzag within the wave [a] or [w] will be formed. That said, a downside correction can come to force in the short period of time. It is confirmed when a bearish impulse in the direction of wave (а) occurs.
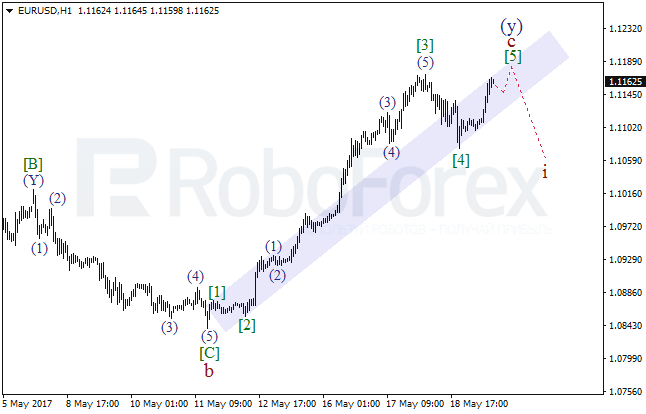
The H1-chart shows a more detailed analysis. The ascending wave c of (y) can give the way for an impulse within the wave [5]. Therefore, in the course of the day a new high can be hit, and afterwards a downside movement within the way i of (a) can start.
GBP USD
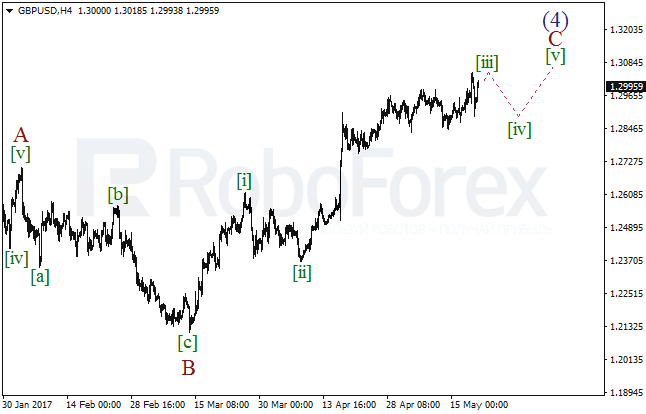
An extension within the wave [iii] is being completed at the moment. In the short run we can see new highs, but after that the pair can start descending within the correction wave [iv] of C.
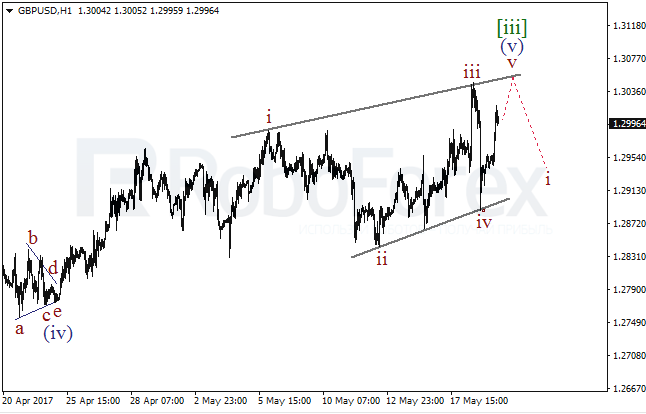
On H-1 chart a diagonal triangle within the wave (v) of [iii] is being completed. In the course of Friday we can see a test of the upper edge of the model. If this edge is rebounded from, the pair can start descending within the wave i.
USD JPY
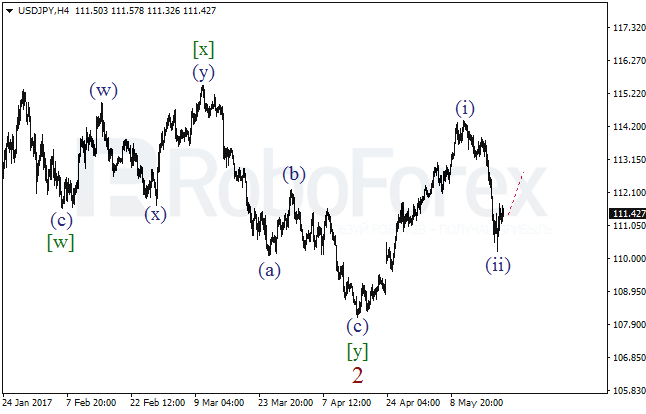
It seems that a descending correction within the wave (ii) is coming to an end. In the short run the price can resume rising and form a bullish impulse in the direction of the wave (iii).
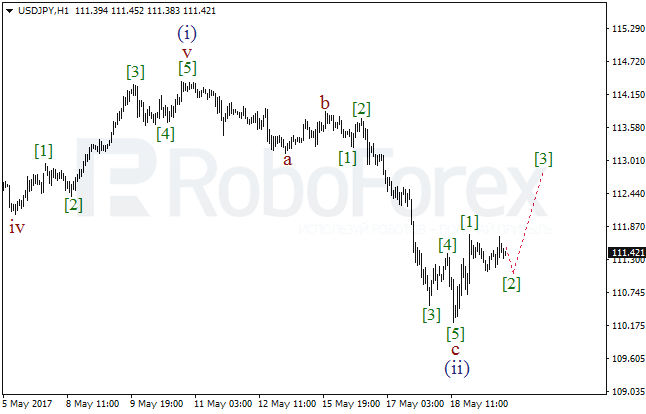
On the H1-chart, after the zigzag within the wave (ii) had been completed, a bullish impulse within the wave [1] was formed. Consequently, afterwards a yet another impule within the wave [3] can occur.
AUD USD
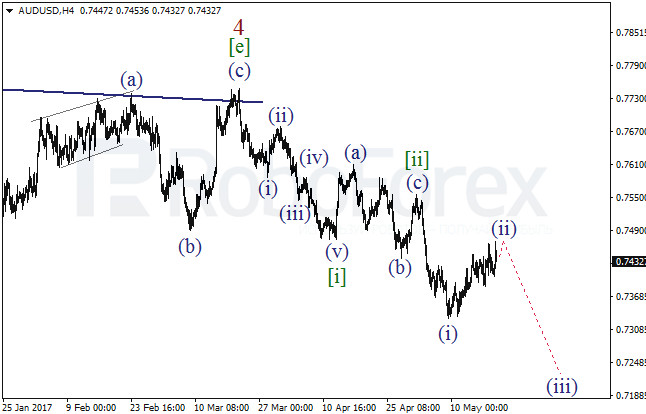
A descending extension within the wave [iii] keeps being formed. The said wave is developing a second wave inside it. In the short run, after the correction is over, the descending move within the wave (iii) of [iii] can resume. Consequentl, soon the price can break through the low of the wave (i).
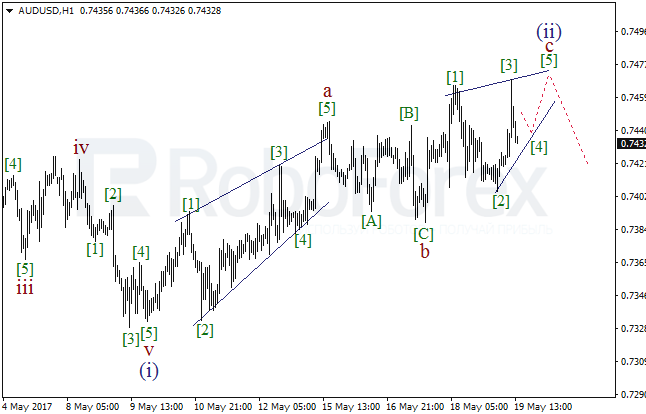
Admittedly, a diagonal triangle within the wave с of (ii) is being developed. If the price rebounds from the upper edge of this model afterwards, the currency pair can resume falling.
Forecasts presented in this section only reflect the author’s private opinion and should not be considered as guidance for trading. RoboForex bears no responsibility for trading results based on trading recommendations described in these analytical reviews.