Wave Analysis 16.05.2017 (EUR/USD)
EUR USD
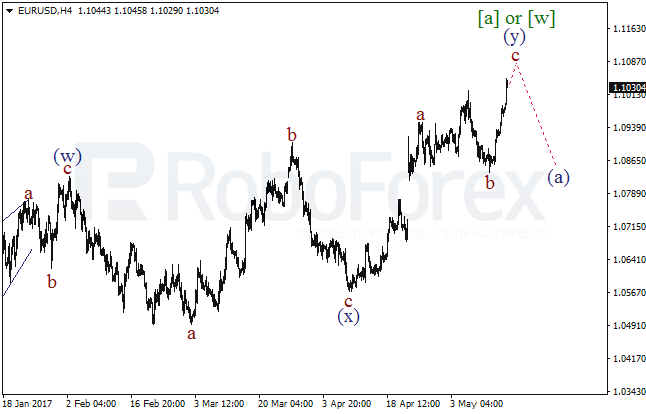
A double zigzag within the wave [a] of [w] continues to form. As a result, in a few coming hours we can see the ascending impulse come to an end within the wave с of (y). If a descending impulse in the direction of the wave (а) is formed, this will be seen as a confirmation of a further rise.
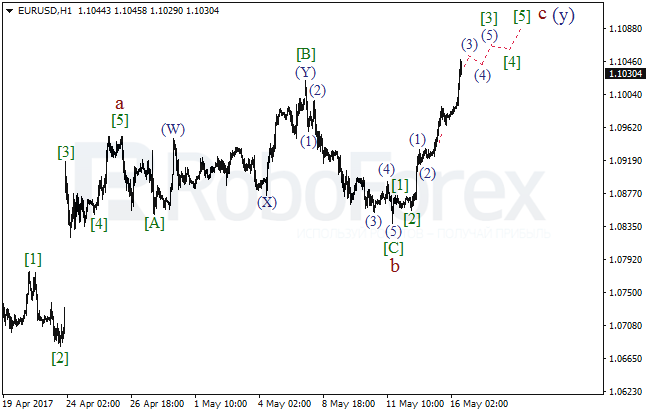
A more detailed picture can be seen on the H1 chart. Admittedly, an extension within the wave [3] of c is formed. Chances are in the course of Tuesday the price will continue moving upwards, but after that it can show a correction.
GBP USD
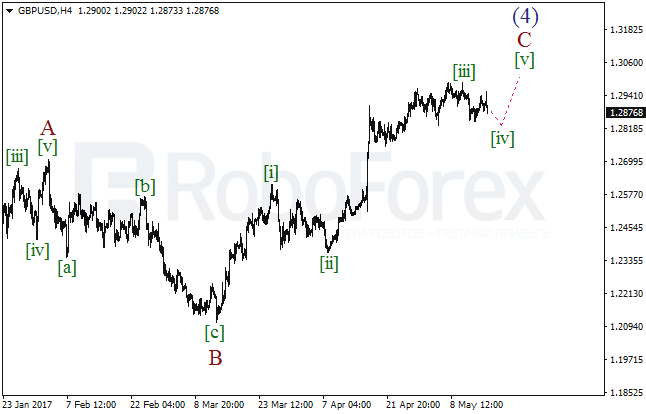
Admittedly, the extension within the wave [iii] has come to an end and a descending correction in the wave [iv] is in place now. In the coming days we can see the consolidation range continue. After that we can probably see a further rise within the wave [v] of C.
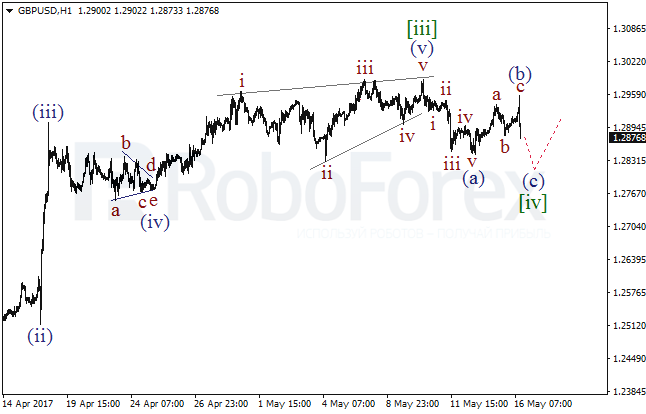
On the H1 chart, within the wave (а) a descending impulse has been formed which was corrected by a zigzag of the wave (b). Correspondingly, the pair can continue declining within the wave (c) of [iv].
USD JPY
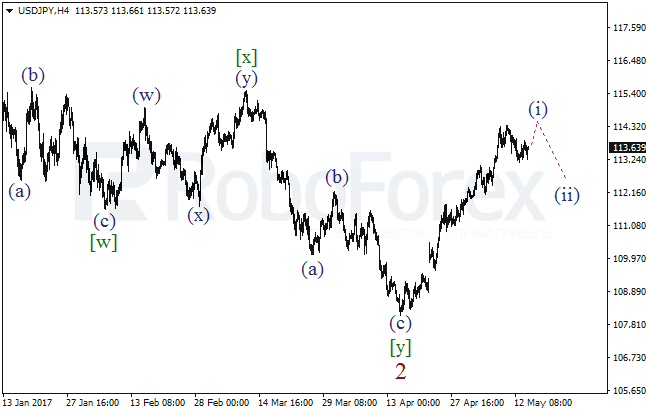
The bullish impuse within the wave (i) has almost come to an end. In the near term, the price can still hit a new local high, but soon after that it can start a descending correction move - the wave (ii).
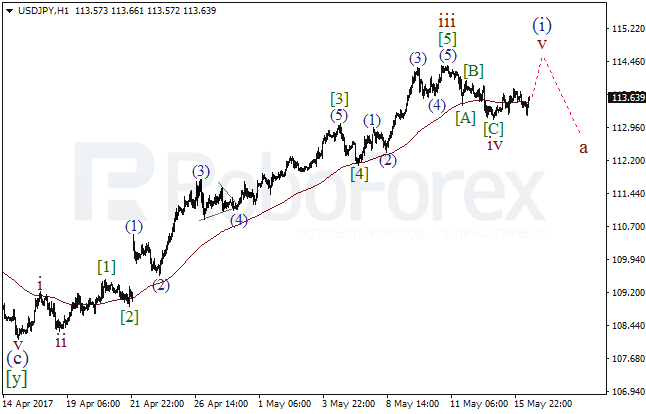
Most probably the wave iv has come to an end forming a zigzag. Earlier a long extension within the wave iii was formed. Consequently, later we can see a yet another bullish impulse within the wave v of (i).
AUD USD
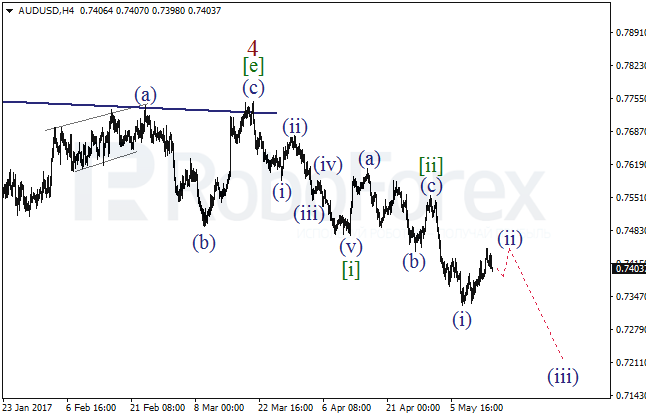
A descending extension is being formed within the wave [iii] which has the second wave within. In the near term, after the correction is over, we can see how the pair resumes declining within the wave (iii) of [iii]. Consequently, in the near term we can see a new low of the wave (i).
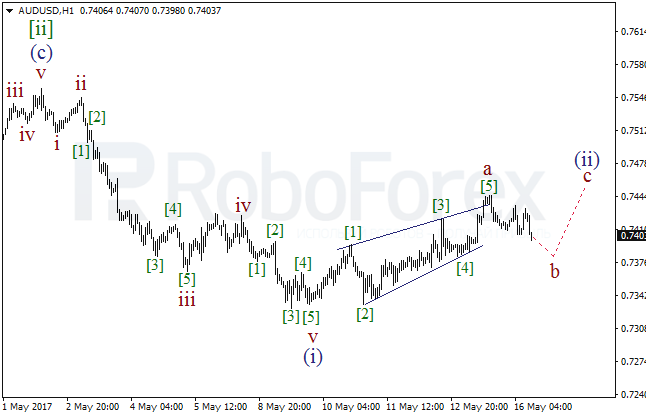
On the H1 chart the wedge has been comleted in the wave a of (ii). As such, after the wave b has been completed, we can see a yet another bullish impulse or diagonal triangle within the wave c of (ii).
Forecasts presented in this section only reflect the author’s private opinion and should not be considered as guidance for trading. RoboForex bears no responsibility for trading results based on trading recommendations described in these analytical reviews.