Wave Analysis 16.02.2017 (EUR/USD, GBP/USD, USD/JPY, AUD/USD)
EUR USD, “Euro vs US Dollar”
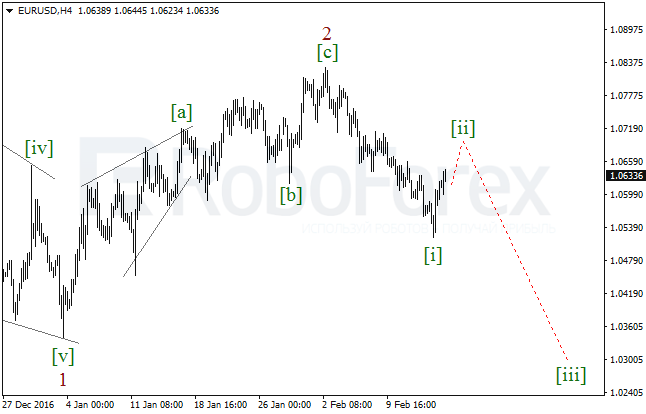
After finishing the zigzag in the wave 2, the EUR/USD pair completed the descending impulse in the wave [i]. Right now, the pair is being corrected. It’s highly likely that during the next several days the market may continue forming the wave [ii].
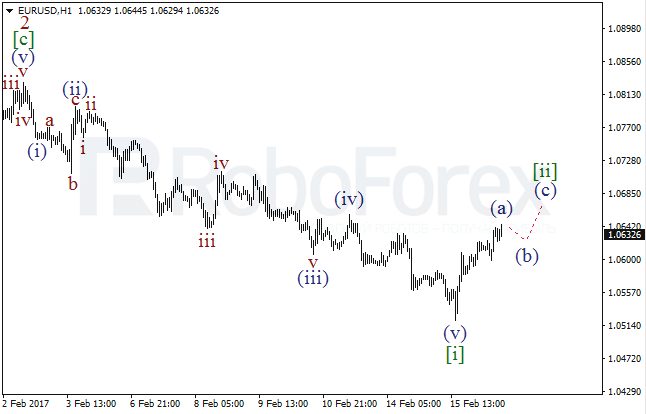
More detailed structure is shown on the H1 chart. Yesterday, the pair completed the wave (v) of [i] and the bullish impulse in the wave (a). In the nearest future, the market may be corrected, but later it is expected to continue growing in the wave (c) of [ii].
GBP USD, “Great Britain Pound vs US Dollar”
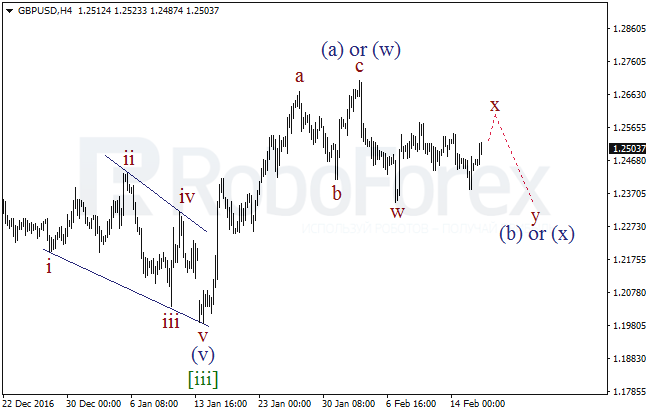
The GBP/USD pair is still forming the wave (b) or (x), which is probably taking the form of the double zigzag. In the nearest future, the market may continue growing in the wave x and, as a result, soon break the local high.
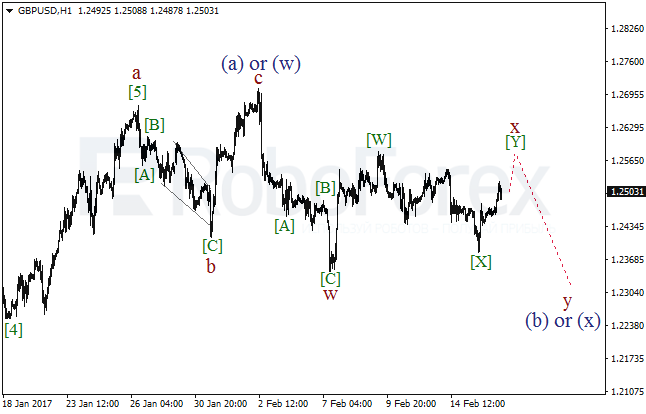
As we can see at the H1 chart, the current correction is getting more complicated. It looks like the pair is completing the wave [Y] of the double zigzag in the wave x. As a result, on Thursday the price may continue moving upwards, but later the market is expected to reverse to the downside and resume falling in the wave y of (b) or (x).
USD JPY, “US Dollar vs Japanese Yen”
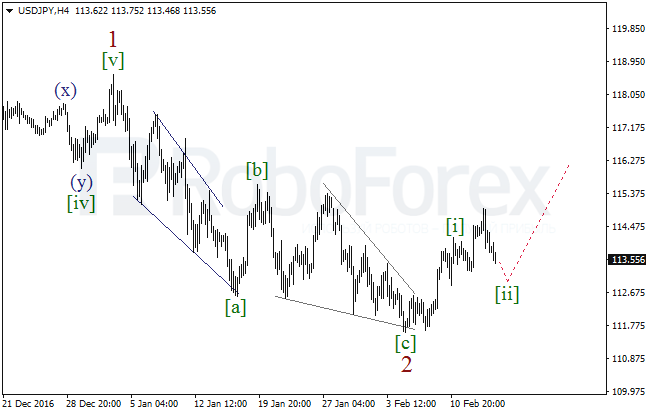
In case of the USD/JPY pair, the price completed the impulse in the wave [i] and right now is being corrected in the wave [ii], which is taking the form of the flat. Consequently, In the nearest future, the market may resume moving upwards and break the local high.
More detailed structure is shown on the H1 chart. Probably, the pair is about to complete the descending impulse in the wave (c) of [ii]. To confirm a new growth, the market has to form the bullish impulse in the wave (i) of [iii].

AUD USD, “Australian Dollar vs US Dollar”
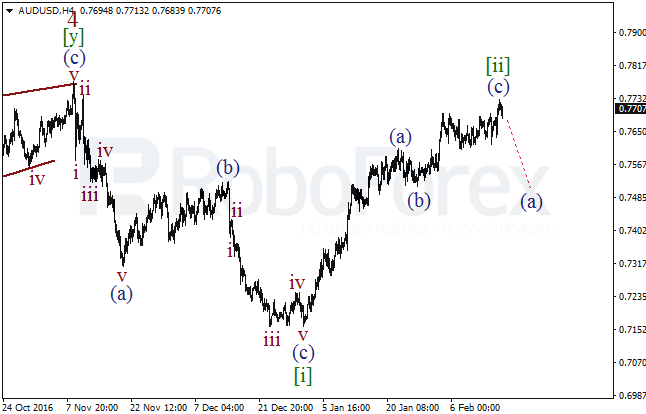
Probably, the AUD/USD pair completed the zigzag[ii] with the impulse (c) inside it. On a longer timeframe, the price is forming the diagonal triangle in the wave 5. Consequently, in the nearest future the market may resume falling in the wave [iii].
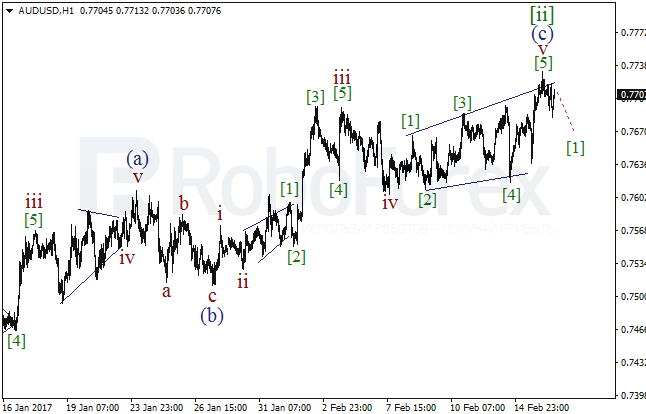
It looks like the pair formed the expanding diagonal triangle in the wave v of (c). However, to confirm a new bearish wave, the price has to form the impulse in the wave [1].
RoboForex Analytical Department
Forecasts presented in this section only reflect the author’s private opinion and should not be considered as guidance for trading. RoboForex bears no responsibility for trading results based on trading recommendations described in these analytical reviews.