Wave Analysis 22.02.2013 (DJIA Index, Crude Oil)
22.02.2013
Analysis for February 22nd, 2013
DJIA Index
It looks like the Index completed an ascending impulse, inside wave 5 of (1). On the minor wave level the price formed an initial impulse inside wave [1]. After a local correction the price may continue moving downwards.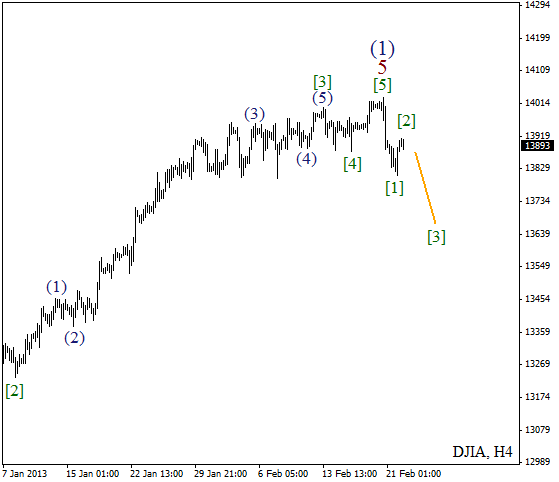
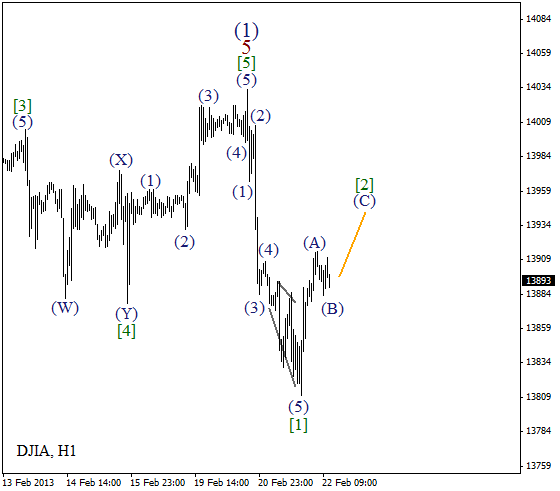
As we can see at the H1 chart, wave (5) was completed in the form of divergent diagonal triangle pattern. Right now the price is forming wave [2] in the form of zigzag pattern. In the nearest future the instrument is expected to move upwards inside wave (C) of [2].
Crude Oil
At the H4 chart Oil is expanding the third wave. On the minor wave level the instrument started forming wave 4. Most likely, in the nearest future the price will start a new descending movement inside wave 5 of (3).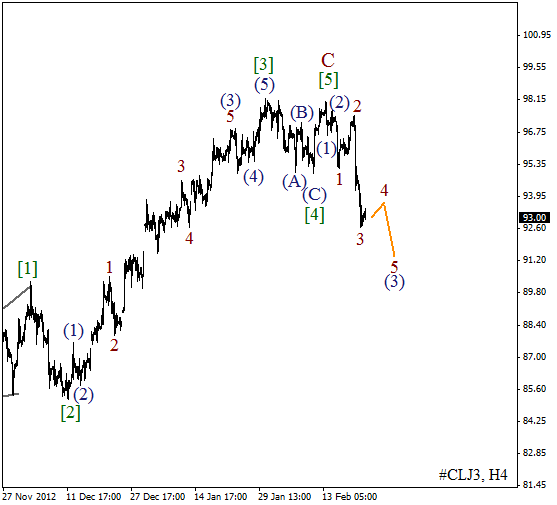
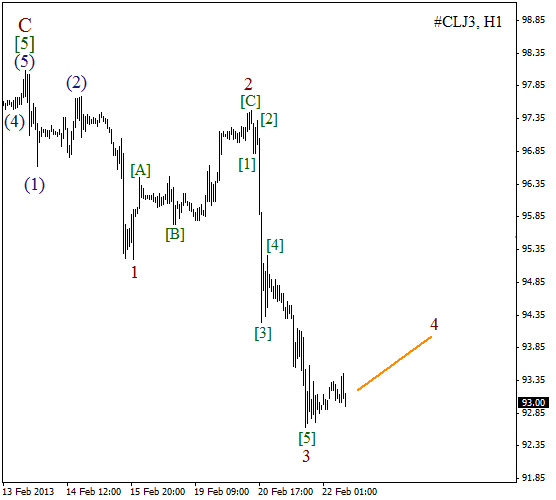
More detailed wave structure is shown on the H1 chart. Oil formed a descending impulse inside the third wave. We can’t exclude a possibility that during the next several hours the price may form a horizontal correction inside wave 4.
RoboForex Analytical Department
Attention!
Forecasts presented in this section only reflect the author’s private opinion and should not be considered as guidance for trading. RoboForex bears no responsibility for trading results based on trading recommendations described in these analytical reviews.