Murray Math Analysis 27.07.2017 (XAU/USD, NZD/USD)
XAU/USD
The H4-chart of XAU/USD shows the pair is at its resistance level 5/8 (1265.63). If price rebounds from this level, gold can move lower towards 4/8 (1250.00) and 3/8 (1234.38) levels. If the 5/8 level is broken through, this will lead to a rise towards 8/8 level (1312.50).
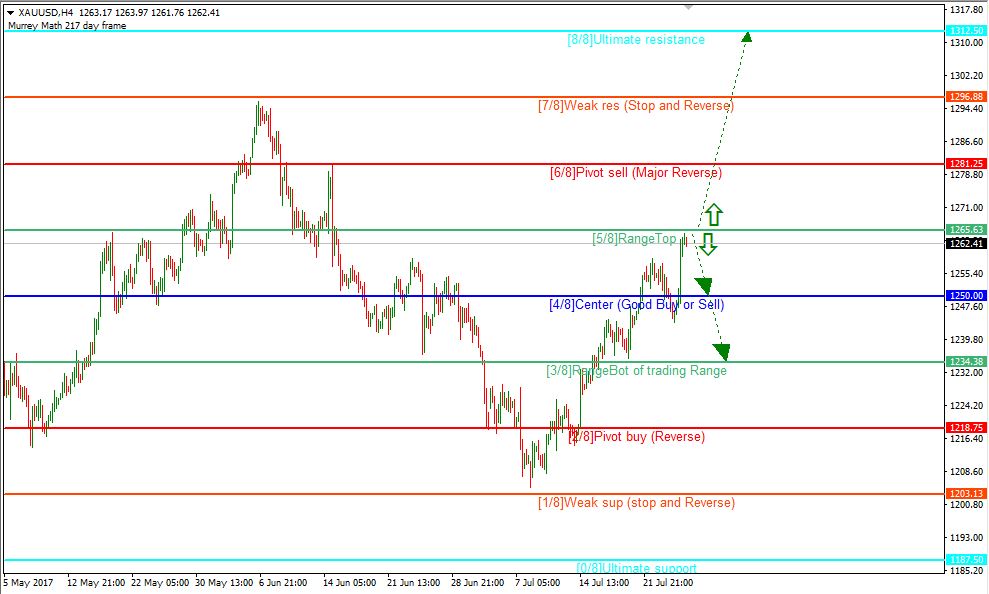
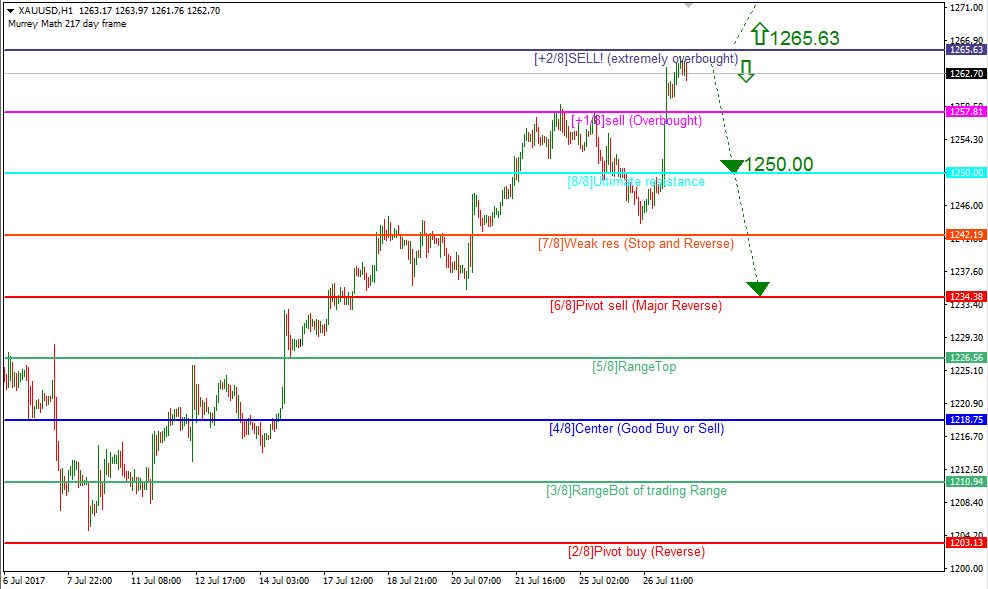
The price is moving inside a buying area above the 8/8 level, and this suggests a possible reversal and further move down. In case the +2/8 level is broken, the Murray analysis will be redrawn and suggest a further rise towards 1312.50.
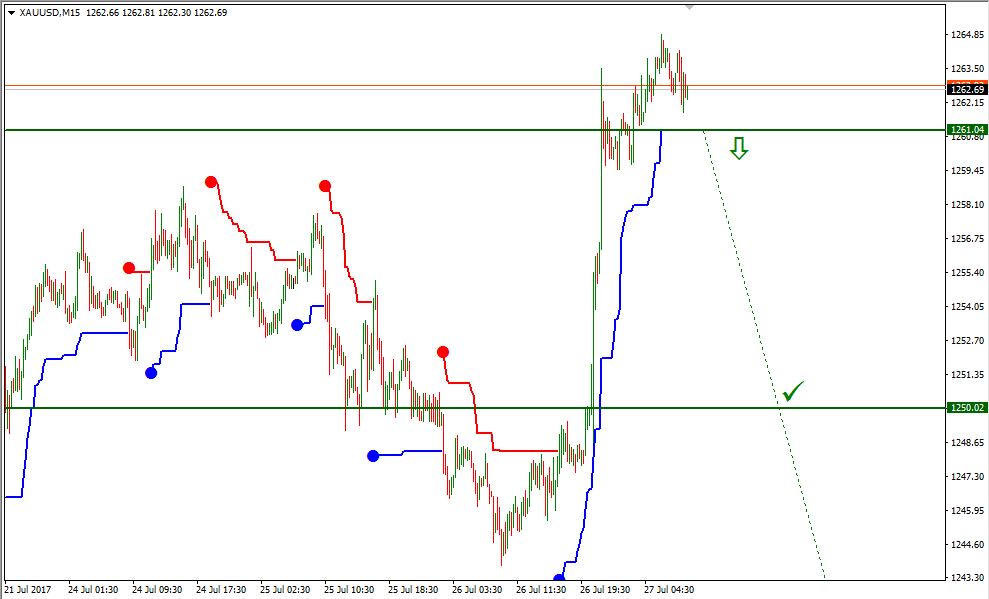
If the lower line of VoltyChannel indicator on M15-chart is broken, price can go lower towards 1250.00 and 1234.38 levels.
NZD/USD
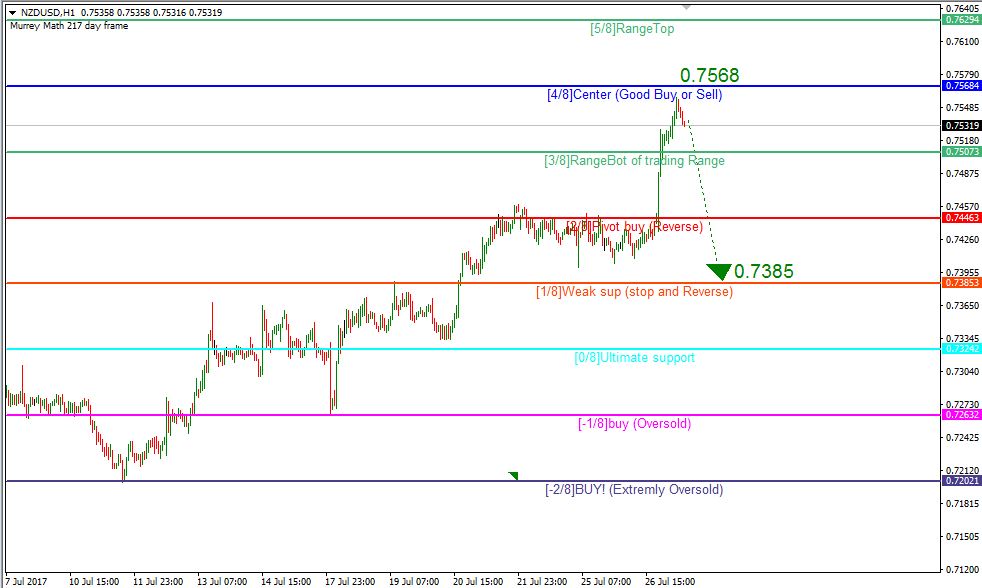
The NZD/USD pair has reached a resistance level 8/8 (07568) on the H4-chart. If price rebounds from this level, it can go lower towards 5/8 (0.7385).
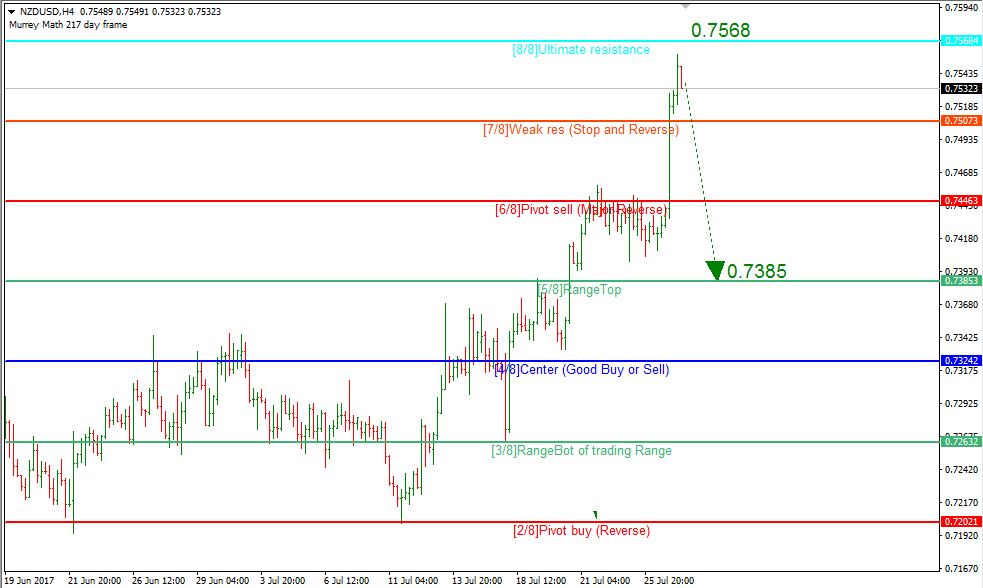
The H1-chart shows price has entered into a channel bounded by 3/8 and 5/8 levels. If it rebounds from the 4/8 level (0.7568), we may see a breakout of the lower edge 3/8 of the channel and further downward move towards 0.7385.
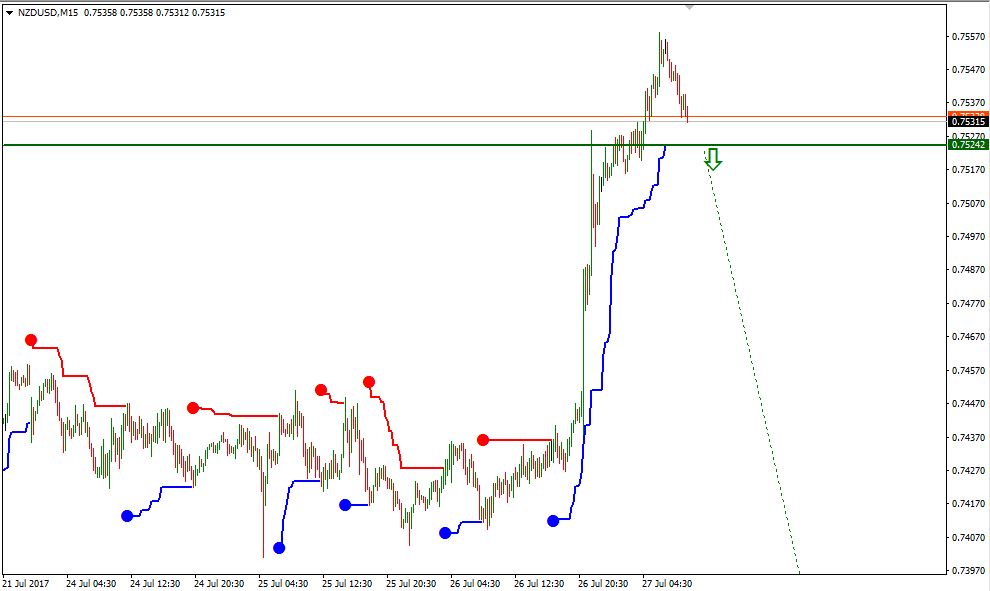
A breakout of the lower line of VoltyChannel indicator on the M15-chart can trigger a descending move towards 0.7385.
Forecasts presented in this section only reflect the author’s private opinion and should not be considered as guidance for trading. RoboForex bears no responsibility for trading results based on trading recommendations described in these analytical reviews.