Murray Math Analysis 21.07.2017 (GBP/USD, EUR/CAD)
GBP/USD
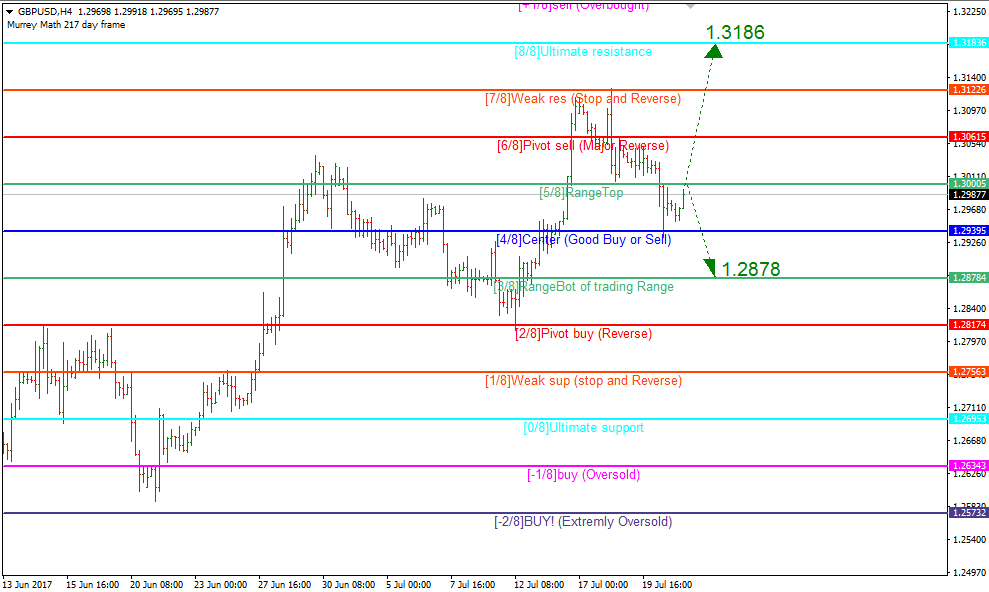
The GBP/USD pair is trading within the channel formed by 3/8 and 5/8 levels. If the 5/8 level (1.3000) is broken, the price can move higher towards 8/8 level (1.3183). If the price rebounds from 5/8 level, this can lead the price to move lower towards 3/8 level (1.2878).
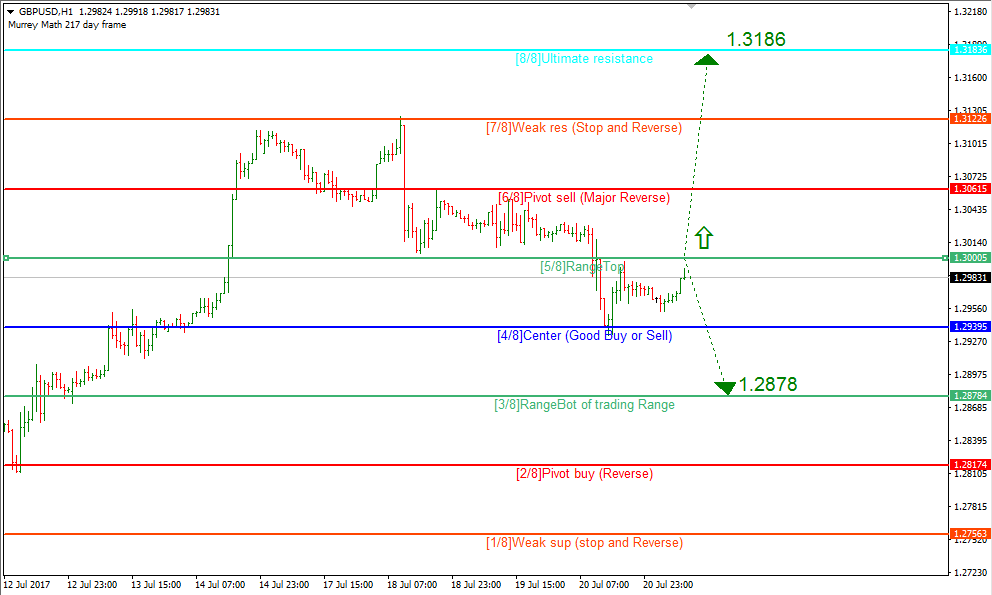
On the H1-chart the Murray lines a aligned completely, and this is confirmed by the scenario on H4-chart.
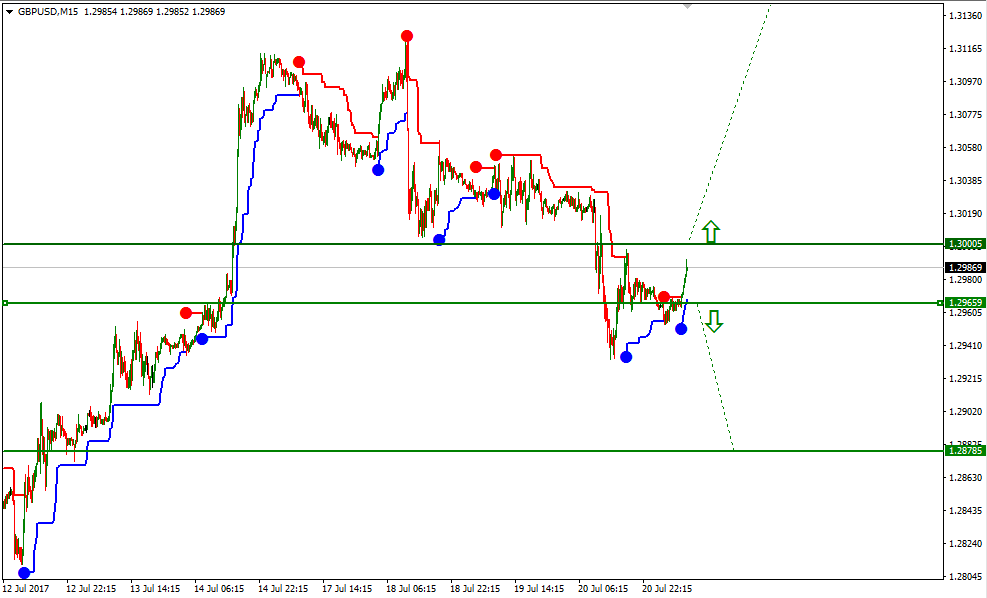
The breakout of the lower line of VoltyChannel indicator on M15-chart will lead to lower prices near 1.2878. If 1.3000 is broken, this will lead to higher prices around 1.3183.
EUR/CAD
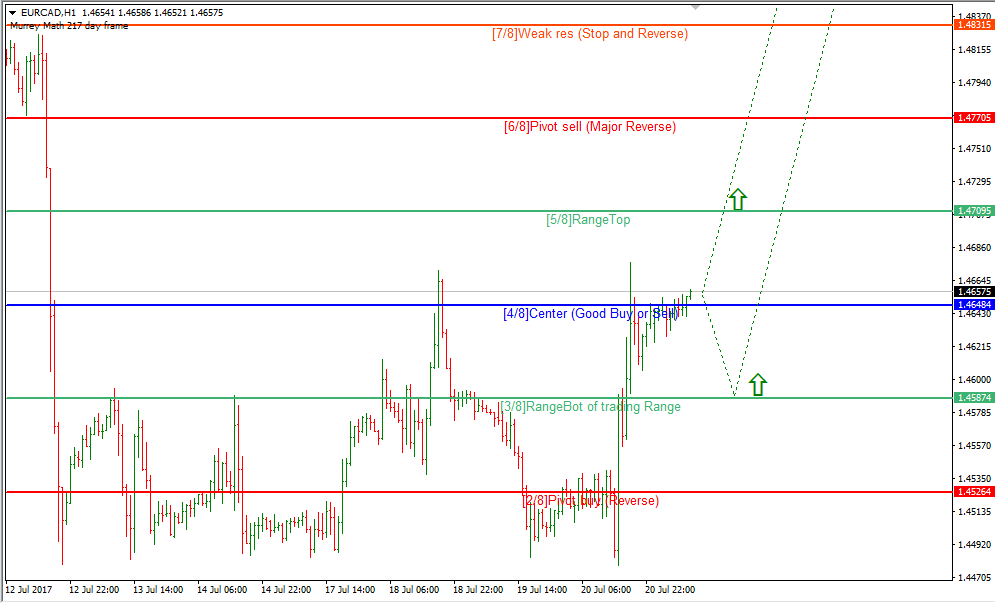
The EUR/CAD pair on the H4-chart is trading at a support level 0/8 (1.4648). If this one is broken, the price can move highet towards 3/8 (1.5014).
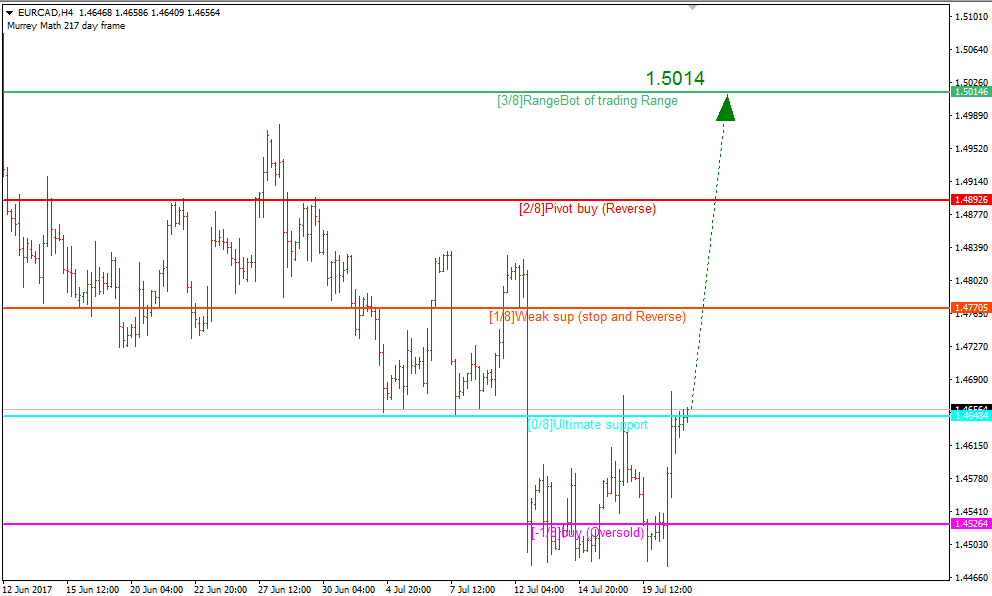
The pair is moving between the 3/8 and 5/8 levels on the H1-chart. In case the pair lowers, it can rebound from the 3/8 level, while further rise and a breakout of 5/8 level (1.4709) will bring the pair to 1.5014 mark.
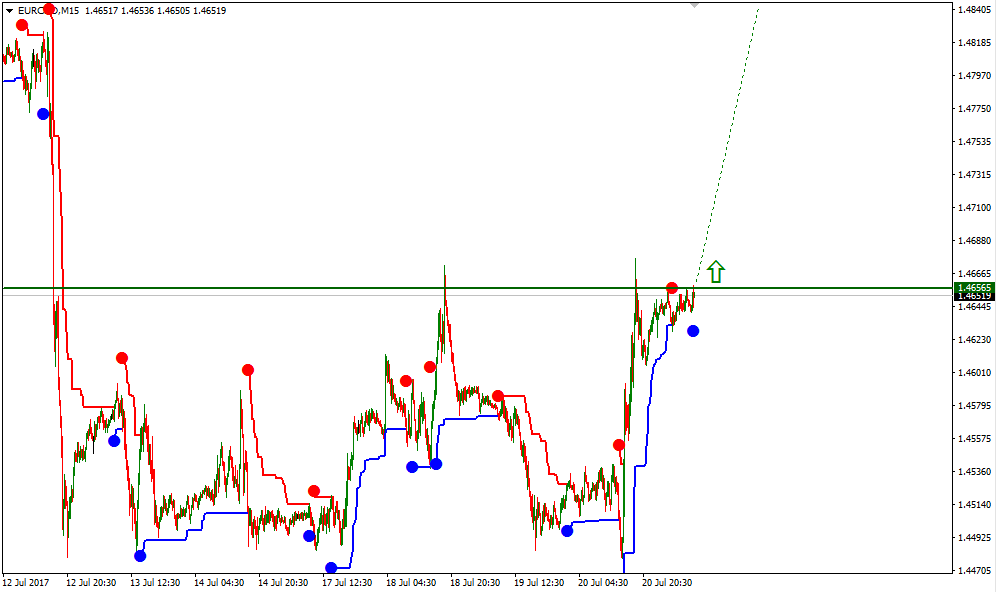
A breakout of the upper line of VoltyChannel indicator on the M15-chart can trigger a rise of the price towards 1.4709 and possible breakout of this level to reach further towards 1.5014.
Forecasts presented in this section only reflect the author’s private opinion and should not be considered as guidance for trading. RoboForex bears no responsibility for trading results based on trading recommendations described in these analytical reviews.