Japanese Candlesticks Analysis for 2013 (EUR/USD, USD/JPY)
19.01.2013
Yearly Analysis for 2013
EUR/USD
The monthly chart of the EUR/USD currency pair shows a bullish tendency on the sideways trend, which started after Harami pattern. Three Line Break chart indicates that the price is slowing down; Heiken Ashi candlesticks confirm an ascending movement.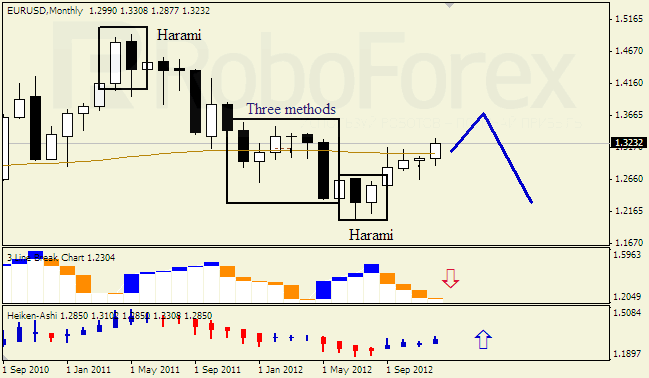
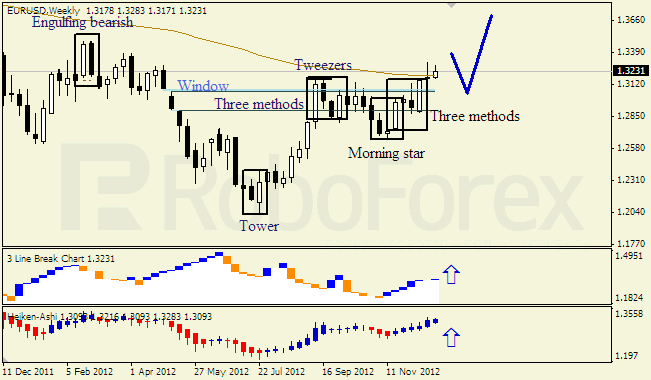
The weekly chart of the EUR/USD currency pair shows a bullish tendency and a possible trend change. The closest Window is a support level. Three Methods pattern, Three Line Break chart, and Heiken Ashi candlesticks confirm an ascending movement, but last week’s Doji candlestick indicates a possible correction up to the support level of the closest Window.
The daily chart of the EUR/USD currency pair shows a bullish tendency on the ascending trend. Shooting Star pattern was stopped by the support level of the closest Window; the pattern’s maximum is a resistance level now. However, in case the maximum of Shooting Start is broken, there is a growing possibility that the upwards Window may become a resistance level. Three Line Break chart and Heiken Ashi candlesticks indicate an ascending movement.

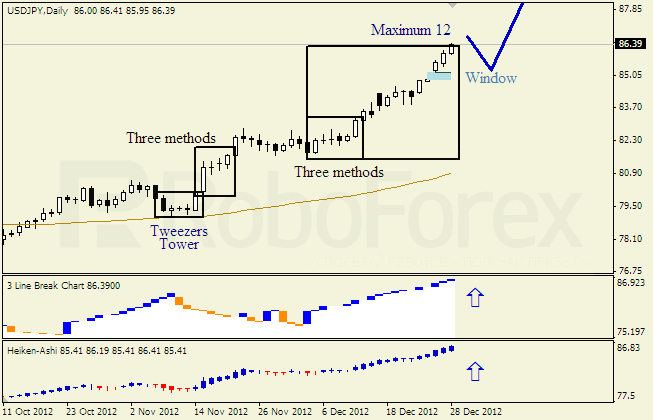
USD/JPY
The monthly chart of the USD/JPY currency pair shows the start of a correction on the descending trend, which is indicated by Package of bullish patterns: Hammer, Tweezers, and Tower. Three Line Break chart and Heiken Ashi candlesticks confirm an ascending movement.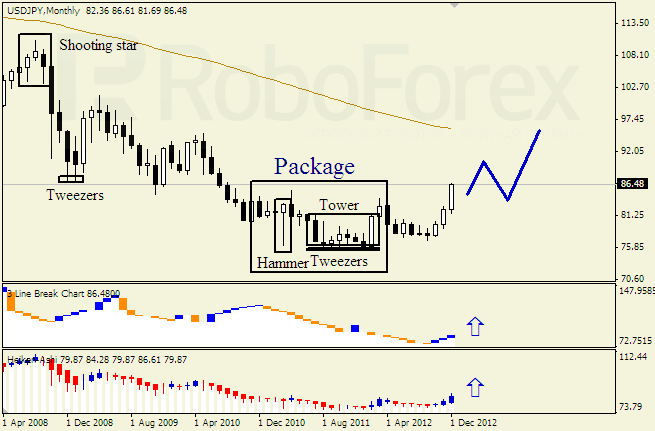
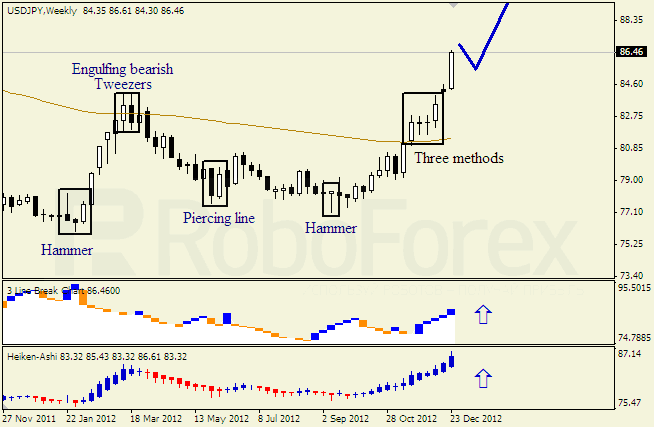
The weekly chart of the USD/JPY currency pair shows a trend change. Three Methods pattern, Three Line Break chart, and Heiken Ashi candlesticks confirm a bullish movement.
The daily chart of the USD/JPY currency pair shows a bullish tendency on the ascending trend. After the previous correction the price set 12 maximums, thus indicating a possible correction up to the support level of the opened Window. The upward Window, Three Line Break chart, and Heiken Ashi candlesticks confirm the ascending trend.
RoboForex Analytical Department
Attention!
Forecasts presented in this section only reflect the author’s private opinion and should not be considered as guidance for trading. RoboForex bears no responsibility for trading results based on trading recommendations described in these analytical reviews.