Fibonacci Retracements Analysis 22.09.2017 (EUR/USD, USD/JPY)
EUR USD, “Euro vs US Dollar”
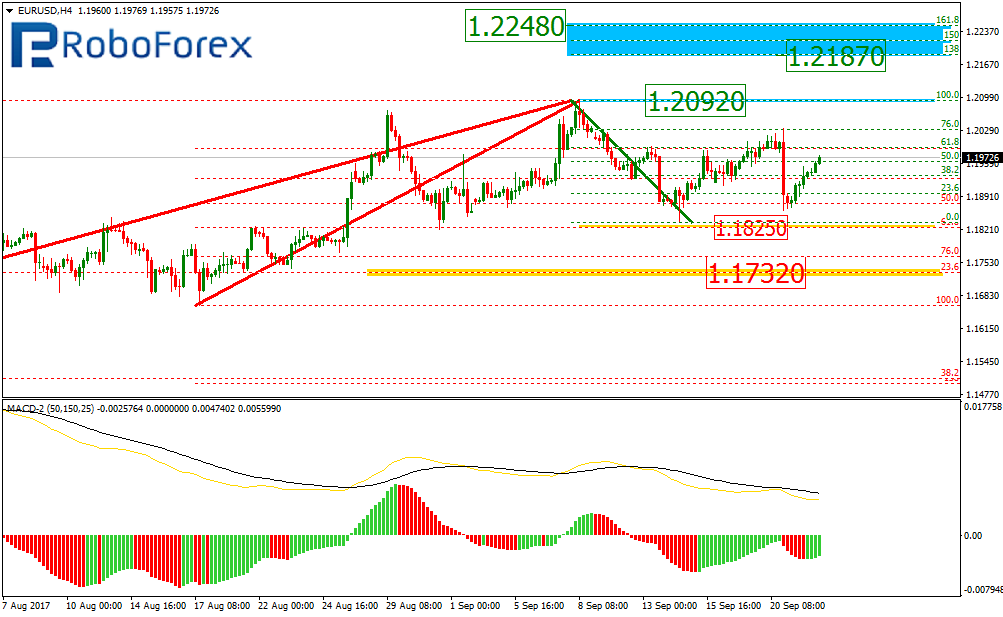
As we can see at the H4 chart, the EUR/USD pair is still being corrected to the downside. The closest target of this correction is the retracement of 23.6% at 1.1730. The main resistance level is at 1.2092. If the price breaks this level, the instrument may continue growing inside the uptrend towards the post-correctional extension area between the retracements of 138.2% and 161.8% at 1.2187 and 1.2248 respectively. The local support at 1.1825.
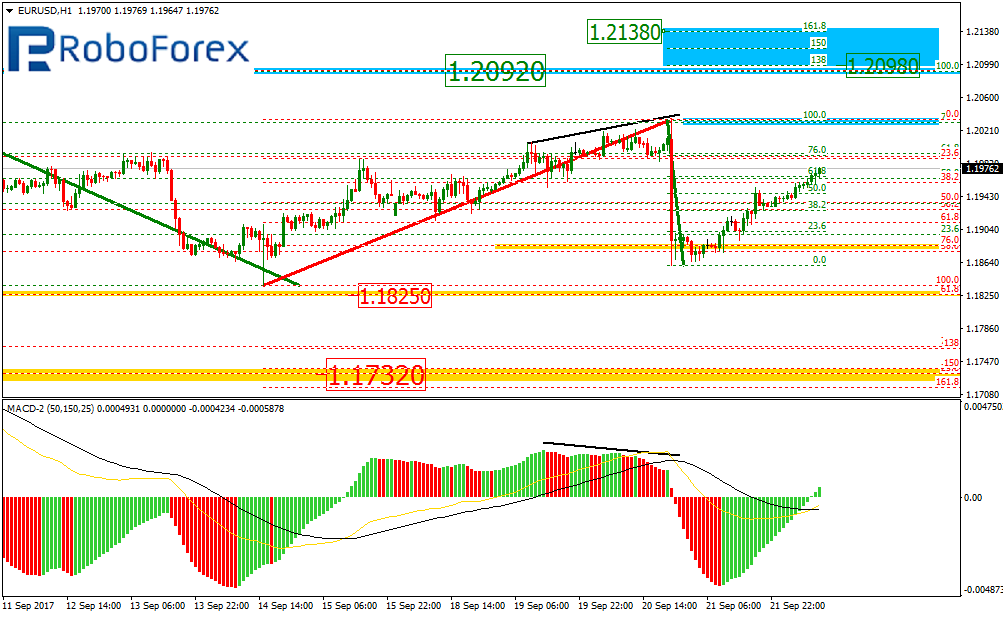
At the H1 chart, the pair is trying to recover after losing momentum yesterday when the news was published. If the price breaks break the local high at 1.2033, the instrument may not only reach the year’s high, but also continue growing towards the post-correctional extension area between the retracements of 138.2% and 161.8% at 1.2098 and 1.2138 respectively.
USD JPY, “US Dollar vs. Japanese Yen”
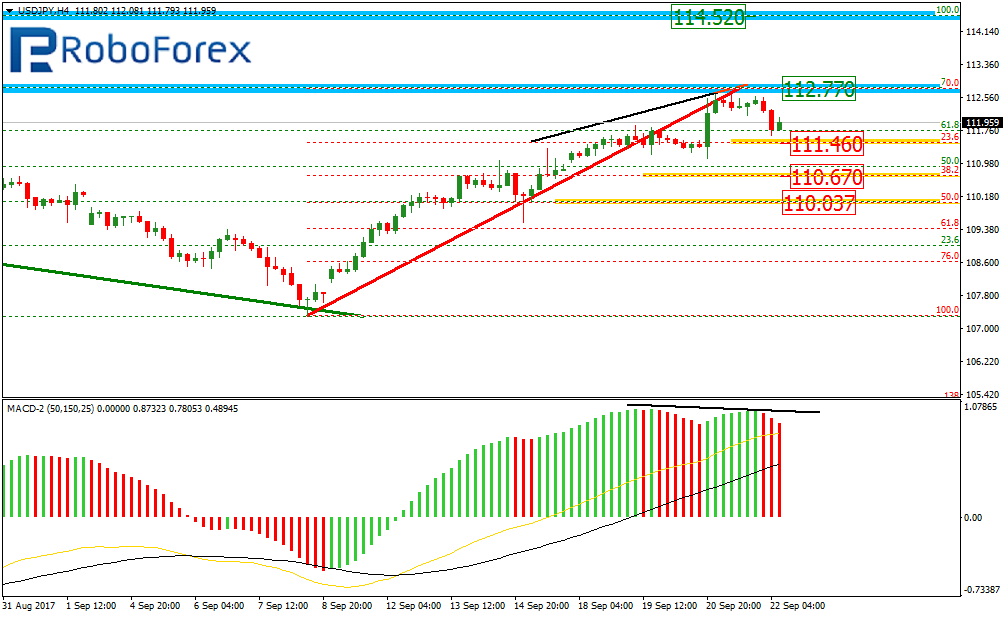
As we can see at the H4 chart, the previous downtrend has been corrected by 76.0%. At the moment, the USD/JPY pair is forming the divergence, which may indicate a possible correction to the downside. The targets of this correction may be at the retracements of 23.6%, 38.2%, and 50.0% at 111.46, 110.67, and 110.03 respectively.
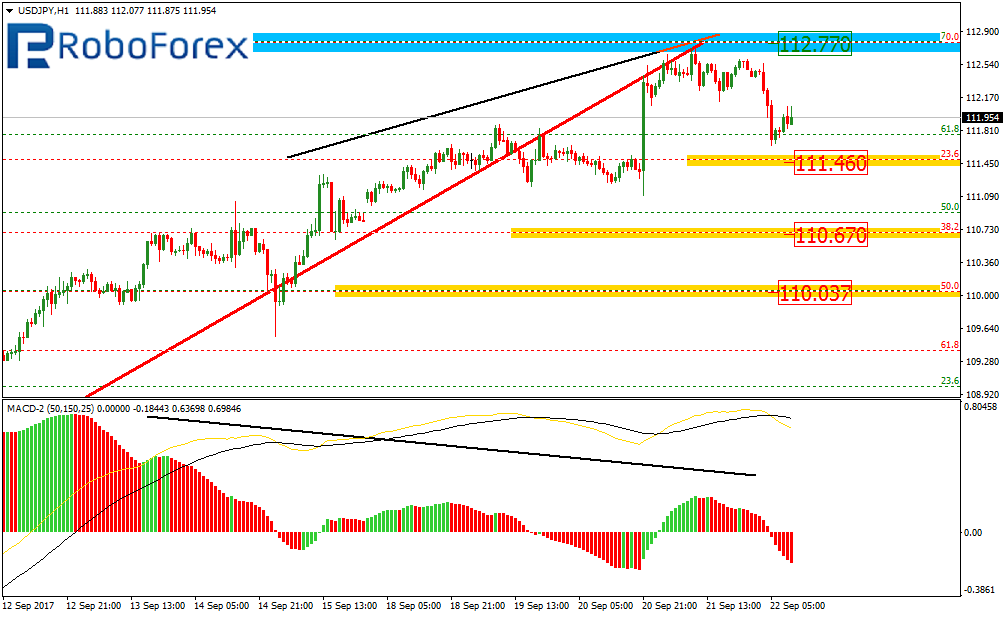
More detailed structure of the correction is shown on the H1 chart. we should also note that if the price breaks the local high at 112.77, it may continue growing towards 114.52.
RoboForex Analytical Department
Forecasts presented in this section only reflect the author’s private opinion and should not be considered as guidance for trading. RoboForex bears no responsibility for trading results based on trading recommendations described in these analytical reviews.