Fibonacci Retracements Analysis 21.07.2017 (GOLD, USD/CHF)
GOLD
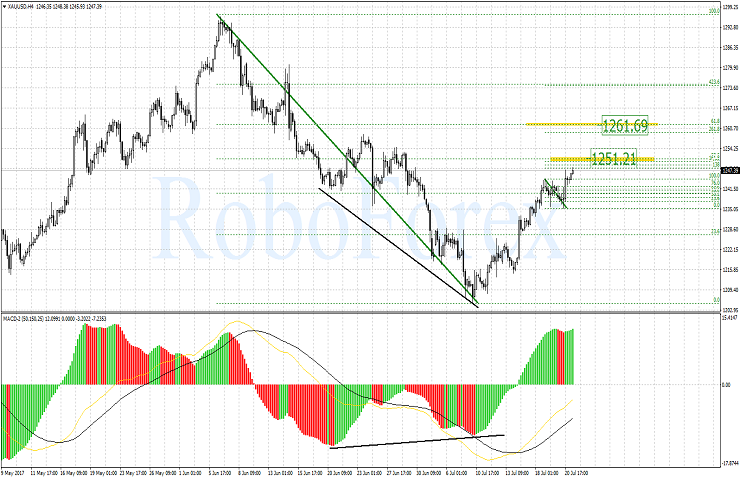
The H4-chart of GOLD shows that the upward movement continues. The nearest target is Fibo 50.0% (1251.21). The next target for the price is 1261.69 (Fibo 61.8%).
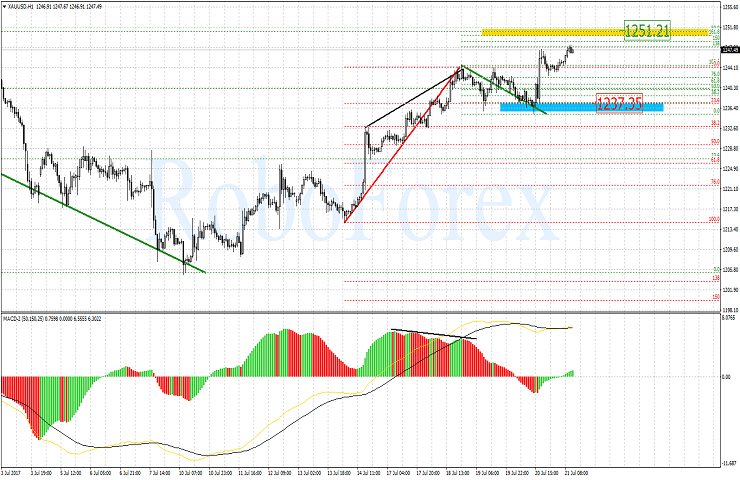
The H1-chart of GOLD confirms continuation of the ascending impulse towards 1251.21. The local low at 1237.35 serves as a support for the uptrend.
USD/CHF
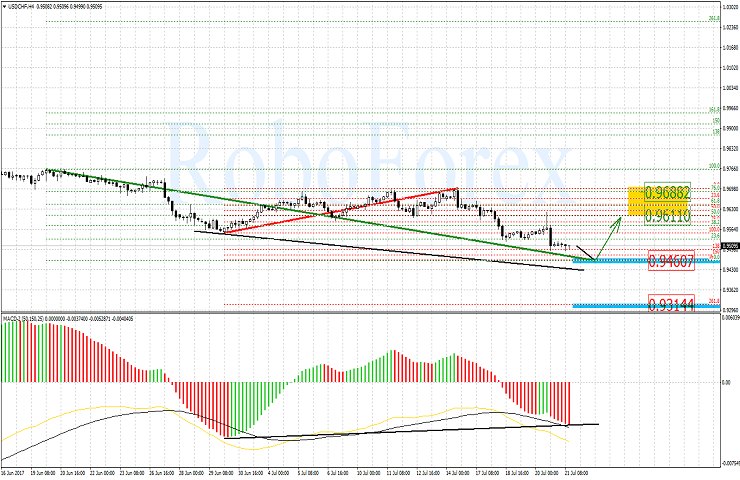
Looking at the H4-chart of USD/CHF we can see a convergence being developed. But the current descending impulse can be extended to 0.9460 mark which corresponds to 161.8% elongation level. If this target is achieved, the price can move higher as a correction descending impulse. A range formed by 50.0% and 76.0% Fibo levels (0.9611 and 0.9688 marks) can be a target for this correction move. But at the same time another scenario can occur: downward move towards 0.9314 mark (261.8% Fibo level).
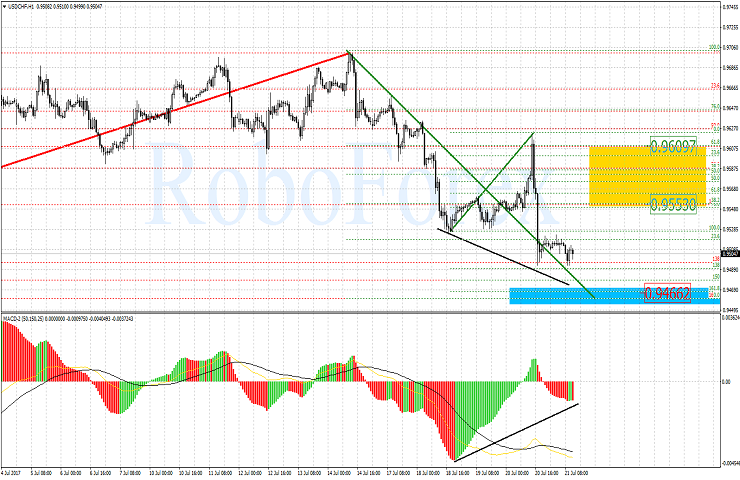
Looking at the H1-chart of USD/CHF we can see that after the new descending impulse had been formed, the pair formed a new descending impulse which reached 138.2% postcorrection level. The Fibo 161.8% level can be the nearest target for the current downtrend. After the current descending impulse is over, the area bounded by 38,2% and 61,8% Fibo levels (0.9553 and 0.9609 marks) can be a possible target for an upward correction move.
Forecasts presented in this section only reflect the author’s private opinion and should not be considered as guidance for trading. RoboForex bears no responsibility for trading results based on trading recommendations described in these analytical reviews.